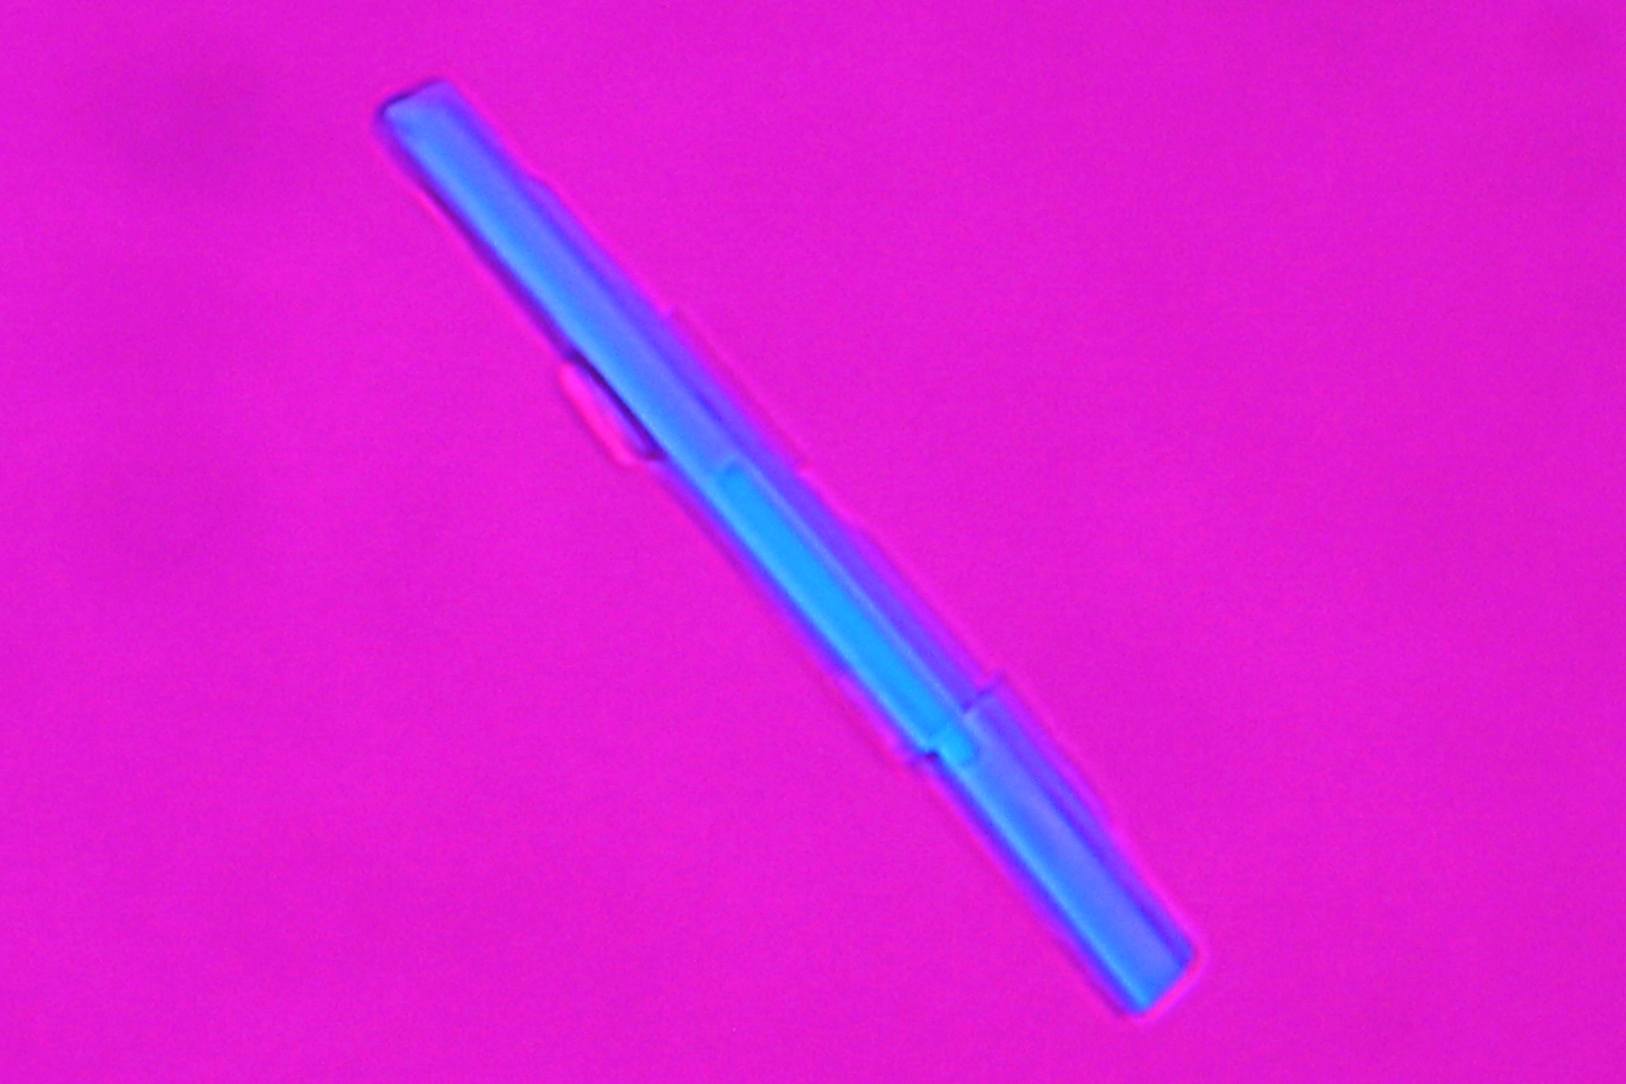
Thecotrichite: Difference between revisions
No edit summary |
No edit summary Tag: Manual revert |
||
| (6 intermediate revisions by the same user not shown) | |||
| Line 48: | Line 48: | ||
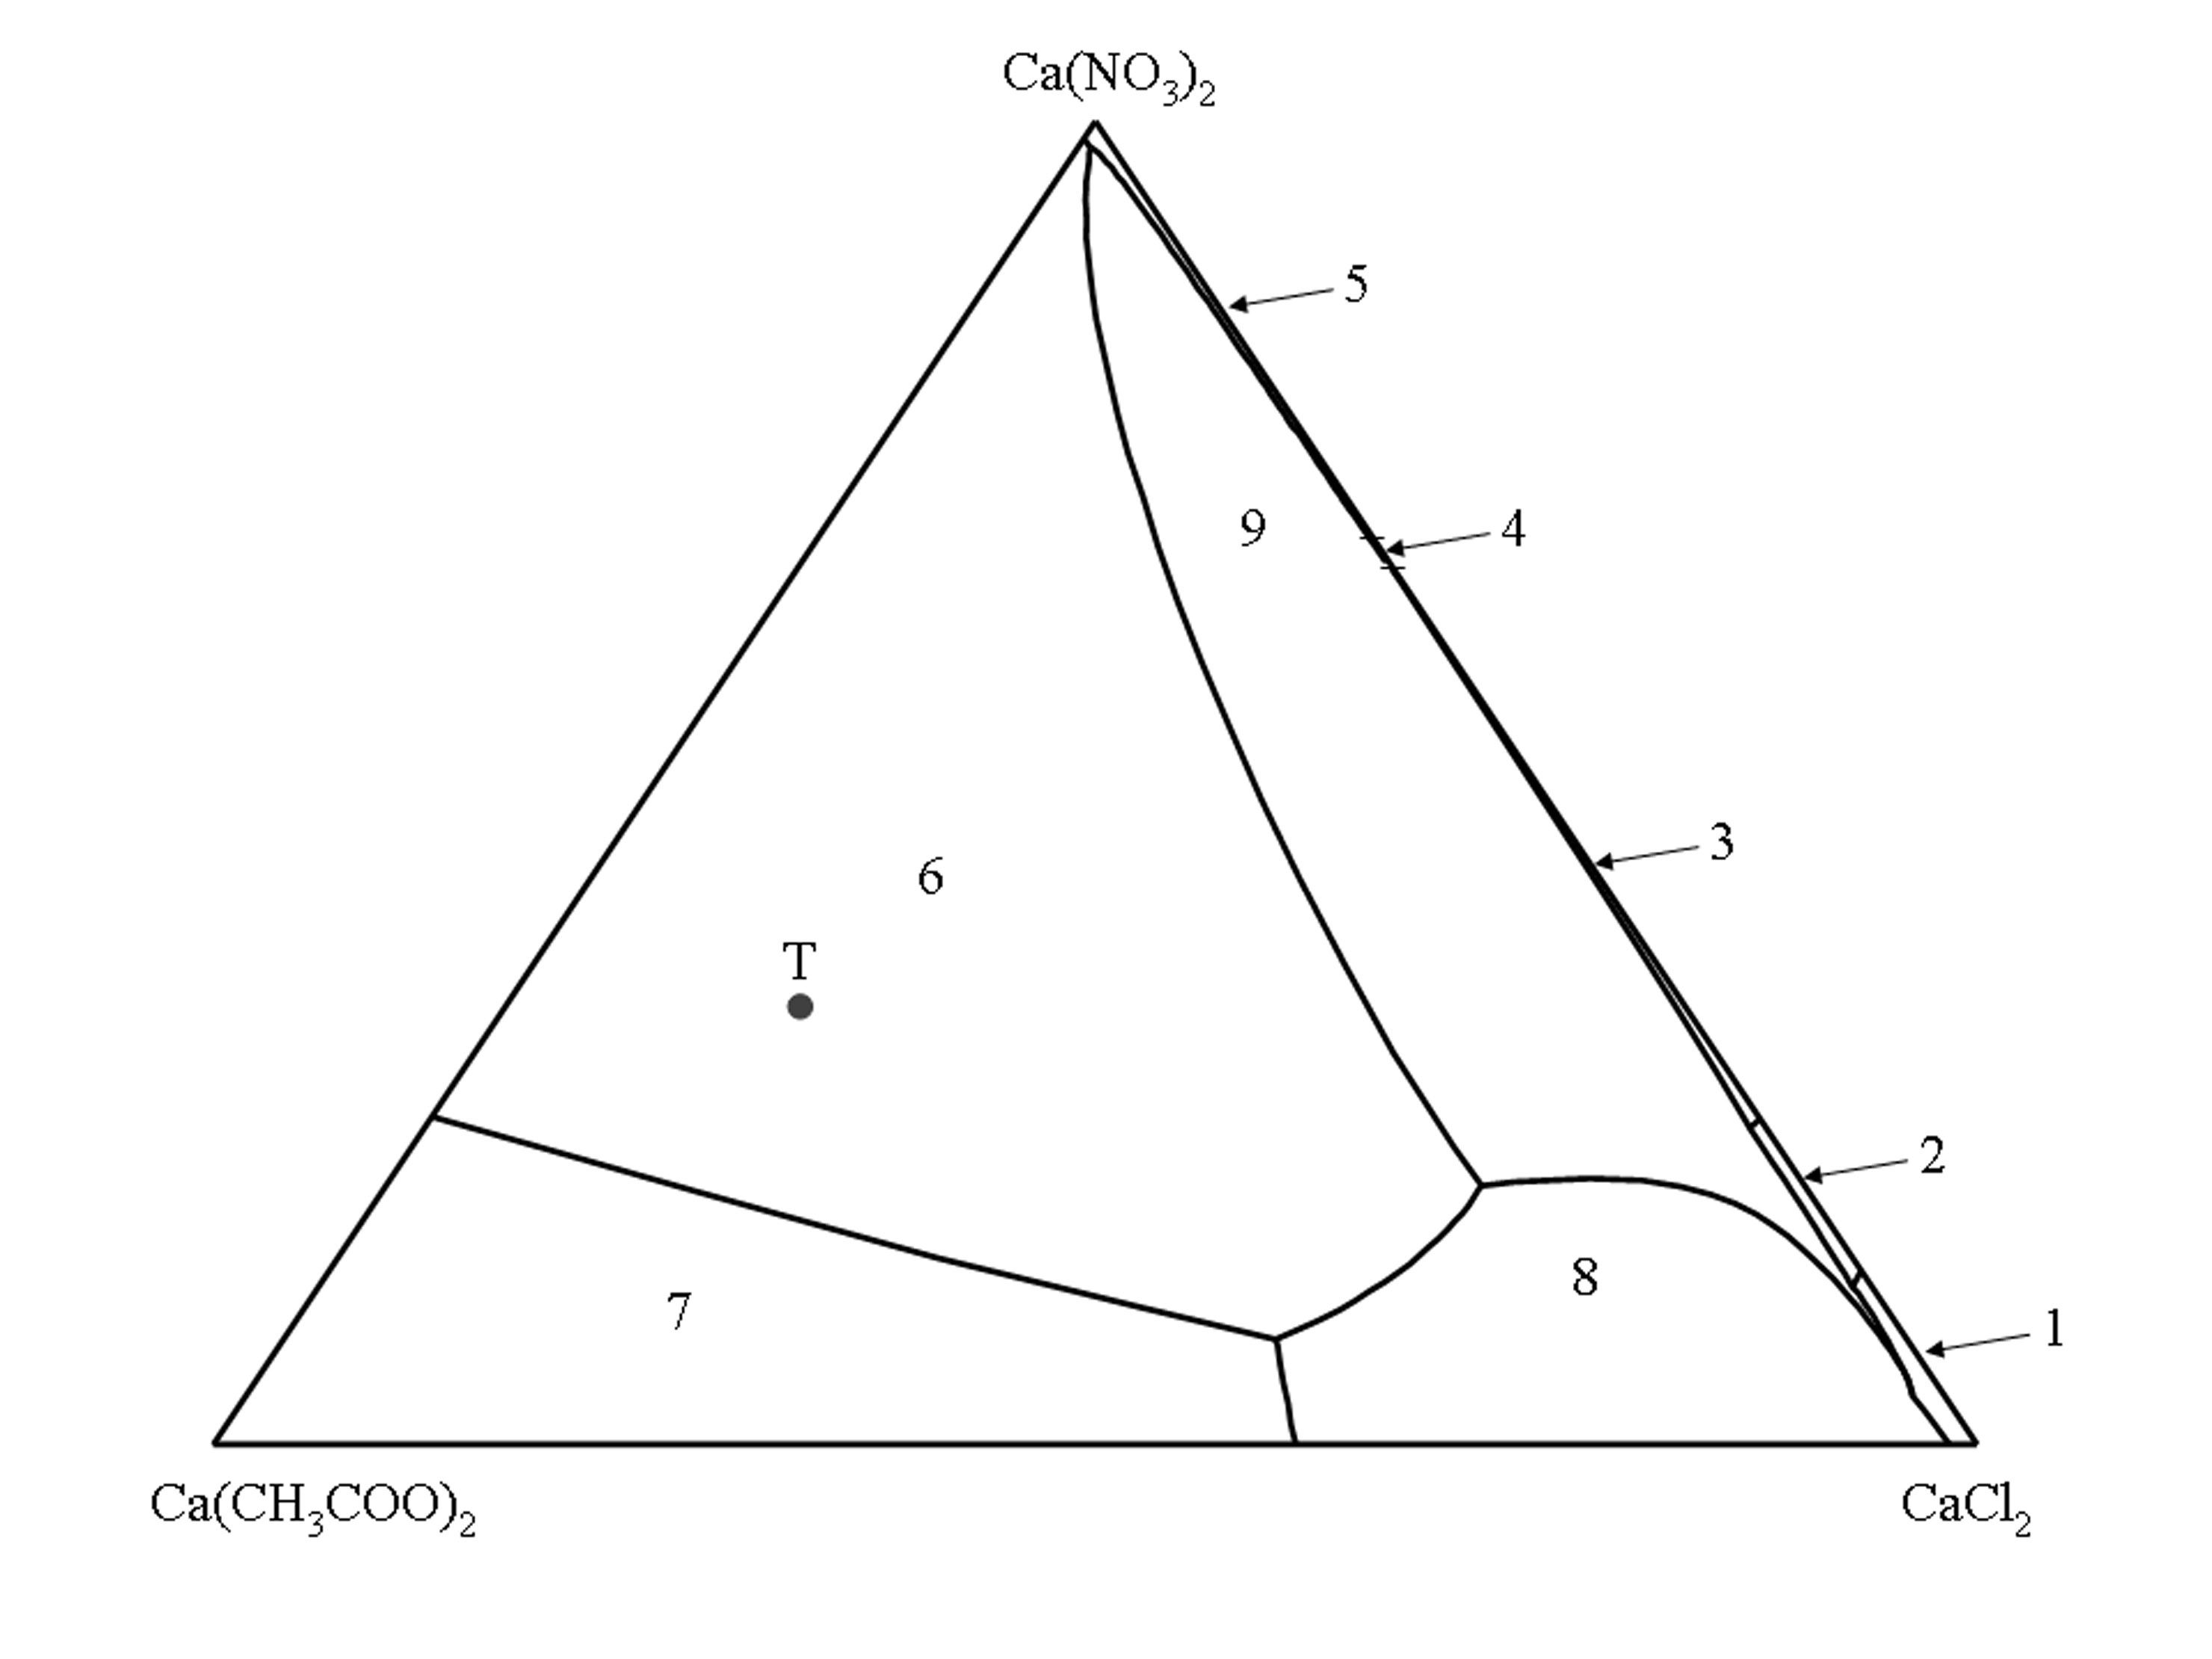
Point T in the phase diagram represents the composition of the triple salt thecotrichite | Point T in the phase diagram represents the composition of the triple salt thecotrichite | ||
(Ca<sub>3</sub>(CH<sub>3</sub>COO)<sub>3</sub>Cl(NO<sub>3</sub>)<sub>2</sub> • 7H<sub>2</sub>O).]] | (Ca<sub>3</sub>(CH<sub>3</sub>COO)<sub>3</sub>Cl(NO<sub>3</sub>)<sub>2</sub> • 7H<sub>2</sub>O).]] | ||
<!-- | <!-- | ||
| Line 109: | Line 106: | ||
== Unter dem Polarisationsmikrokop == | == Unter dem Polarisationsmikrokop == | ||
== Unter dem Rasterelektronenmikroskop ==--> | == Unter dem Rasterelektronenmikroskop == | ||
--> | |||
<br clear="all"> | <br clear="all"> | ||
Latest revision as of 08:05, 8 August 2023
Author: Kirsten Linnow
back to Organic Salts
| Thecotrichite[1][2] | |

| |
| Mineralogical name | Thecotrichite |
| Chemical name | Tricalcium triacetate chloride dinitrate heptahydrate |
| Trivial name | |
| Chemical formula | Ca3(CH3COO)3Cl(NO3)2•7H2O |
| Other forms | |
| Crystal system | |
| Crystal structure | |
| Deliquescence humidity 20°C | 85% (20°C) |
| Solubility (g/l) at 20°C | |
| Density (g/cm³) | |
| Molar volume | |
| Molar weight | 582.936 g/mol |
| Transparency | |
| Cleavage | |
| Crystal habit | |
| Twinning | |
| Phase transition | |
| Chemical behavior | |
| Comments | found on calcareous museum objects and archaeological ceramic objects]] |
| Crystal Optics | |
| Refractive Indices | nx = 1.491 ± 0.001 nz = 1.494 ± 0.003 |
| Birefringence | |
| Optical Orientation | |
| Pleochroism | |
| Dispersion | |
| Used Literature | |
Phase diagram of the quaternary system Ca(CH3COO)2–CaCl2–Ca(NO3)2–H2O[edit]
The isothermal phase diagram of the quaternary system Ca(CH3COO)2–CaCl2–Ca(NO3)2–H2O (25°C) [Linnow:2007]Title: Salt damage in porous materials: An RH XRD investigation
Author: Linnow, Kirsten is shown as Jännecke projection for the anhydrous level. All solution compositions are given as molar ratios of Ca(CH3COO)2, CaCl2 and Ca(NO3)2.
The corners of the triangle represent the three pure salts, the sides represent the three ternary systems Ca(CH3COO)2–CaCl2–H2O, Ca(CH3COO)2–Ca(NO3)2–H2O and CaCl2–Ca(NO3)2–H2 while the inner surface represents all solution compositions where the three salts are involved.
The inner lines delimit the stability fields of a given salt phase. The stability fields represent all solution compositions, which are saturated with respect to only a single salt phase. The univariant lines represent the solution compositions where two salt phases are in equilibrium with the solution.
According to Gibbs’ phase rule in the quaternary system a maximum of three different salt phases can coexist in solution equilibrium. It follows that for each possible combination of three salt phases in the solid phase, only one saturated solution composition is possible. These solution combinations are represented by intersections of the univariant lines.

(1) CaCl2 • 6H2O, (2) CaCl2 • 4H2O, (3) CaCl(NO3) • 2H2O, (4) Ca(NO3)2 • 3H2O, (5) Ca(NO3)2 • 4H2O, (6) Ca2(CH3COO)3(NO3) • 2H2O, (7) Ca(CH3COO)2 • H2O, (8) Ca(CH3COO)Cl • 5H2O, (9) Ca3(CH3COO)3Cl(NO3)2 • 7H2O.
Point T in the phase diagram represents the composition of the triple salt thecotrichite (Ca3(CH3COO)3Cl(NO3)2 • 7H2O).
Weblinks[edit]
Literature[edit]
| [Linnow:2007] | Linnow, Kirsten (2007): Salt damage in porous materials: An RH XRD investigation. Dissertation, Institut für Anorganische und Angewandte Chemie, Universität Hamburg, Url |  |