Salts/Salt Mixtures
Author: Amelie Stahlbuhk
back to SalzWiki:Portal
Abstract[edit]
The key properties of salts and salt mixtures are described by means of phase and solubility diagrams. Mainly those salts relevant to cultural heritage objects are addressed.
Salts in cultural heritage objects[edit]
Salts are based on ionic compounds, having both positively charged ions (cations) and a negatively charged ions (anions). Both cations and anions can have one or more positive or negative charges but they must balance out in the salt. Cultural heritage objects of porous, inorganic materials, such as buildings monuments, may be contaminated with salts. The most common cations are sodium (Na+), potassium (K+)), magnesium (Mg++)and calcium (Ca++). For the case of anions, the most frequently found are chloride (Cl-), sulfate (SO4=), nitrate (NO3-)and carbonate(CO3=). Depending on the environment of the object, origin of the salts and past restorations/conservation measure, there may be other cations present, such as barium (Ba++) or ammonium (NH4+), or anions, such as acetate (CH3COO-). The latter one is particularly relevant in the case where objects, such as ceramics, are displayed or stored in wooden cases which emit acetic acid over time, resulting in the efflorescence of an acetate salt, such as sodium or potassium from the object itself. In the case of metal objects, other cations may also appear. The following section will focus mainly on the most common minerals.
Single, double or triple salt[edit]
Salts can be differentiated depending on the number of cations or anions they contain. If there is only one cation and one anion, such as in sodium chloride ([halite], NaCl), then it is a single salt. An example of a double salt could be that of darapskite, which contains only one cation, sodium, but two different anions, sulfate and nitrate(Na3(SO4)(NO3)∙H2O) as well as aphtitalite, which has two cations sodium and potassium, but only one anion, sulfate K3Na(SO4)2). However, this formula could also be written as follows: Na2SO4∙3K2SO4 or (K3Na(SO4)2), the former showing that the salt is actually composed by a combination of two single salts.
Some double salts may be found on building materials, these may form depending on environmental conditions, as well as triple salts; the latter, according to the definition may have three different cations or anions, however, these are not found as frequently.
In the case of double salts, some may differentiate themselves depending on whether they have a congruent or incongruent solubility. In the case of a congruent solubility, when the salt dissolves in water, the solution will have the same mixture of anions and cations as the salt itself, and when it evaporates, the same salt will precipitate out. In the case of incongruent solubility, depending on the concentration of the produced solution, other phases may crystallize out, so that the solution will no longer have the same composition as the original salt, therefore, when the solution evaporates completely, the original salt will not necessarily be obtained, since some phases had separated previously. The crystallization and dissolution processes of incongruent salts is very complex and information regarding their solubility and crystallization processes is not easily predictable.
Salt solubility[edit]
Salts have distinct solubilities that are temperature dependent. For buildings contaminated by salts this is an important point, since the mobility of a particular salt will depend on its solubility; those with lower solubility will crystallize sooner. Considering a wall with rising damp, where the ground water and the salts is contains rises by capillarity, a fractionation of the salts can be detected. Salts with low solubility will crystallize out close to where the water enters the wall, while highly soluble salts may rise higher [Arnold.etal:1991]Title: Monitoring Wall Paintings Affected by soluble Salts
Author: Arnold, Andreas; Zehnder, Konrad .
.
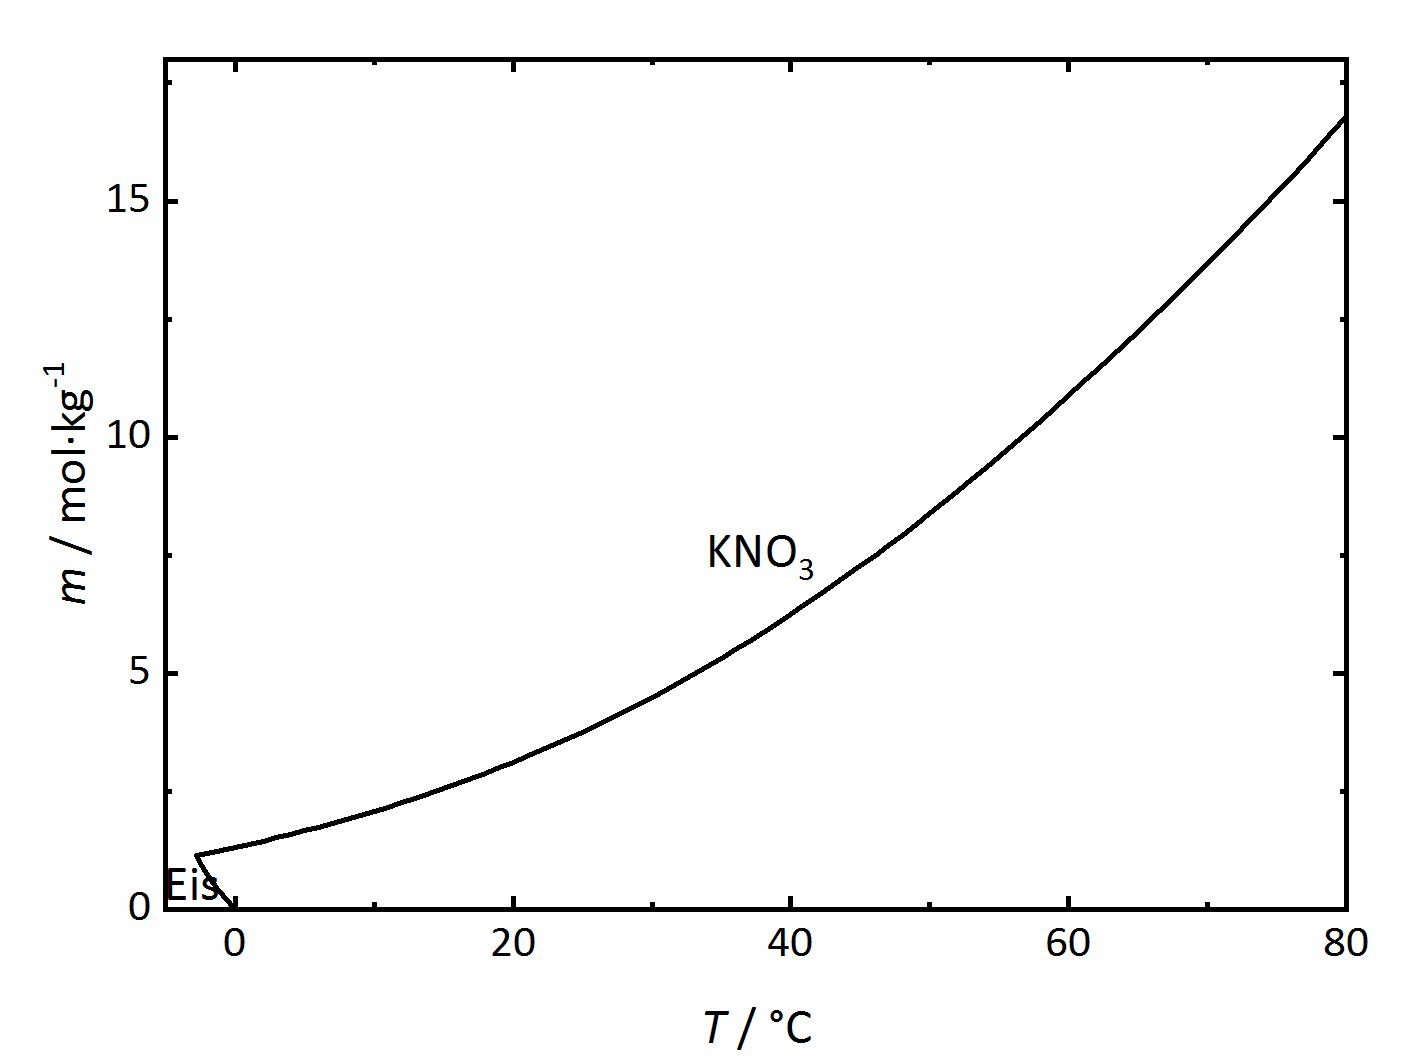
The solubility temperature dependence can be described by solubility diagrams. To illustrate the point the solubility diagram for a single salt, such as potassium nitrate, is shown in Fig. 1. In this diagram, the solubility of the salt in water is given by its concentration expressed in molality (mol/kgsolvent, where the solvent considered here is always water) as the ordinate axis as a function of temperature as the abscissa axis. The black line in the diagram reflects the saturation concentration of the salt as a function of the temperature. At 20°C, the solution of the potassium nitrate would have a molality of 3.1 mol/kg corresponding to a saturated solution. Below the line, the solution is not saturated, above the line the solution is saturated and salt will precipitate out if above that concentration. In the case of this salt, the solubility increases with temperature. At very low temperatures, ice will also crystallize out.
For a given salt, the equilibrium between crystallization and dissolution can be described by the following equation:
Mν,MXν,X•ν0H2O ⇌ νMMzM++νXXzX-+ν0H2O (Eq. 1)
M and X are the cations and anions with their number ν and their charge z while ν0 represents the number of possible water molecules, so that the equation can also be applied to hydrated salts. The corresponding equilibrium constant is the solubility product lnKMX.
lnKMX=νMlnmM+νXlnmX+νMlnγM+νXlnγX+ν0lnaw (Eq. 2)
The molalities are m and the activation coefficient of the cations and anions in a saturated solution of the salt is given by γ while the water activity is given by aw.
aw=RH=pw/pw,0 (Eq. 3)
In the above, the actual water vapor partial pressure is given by pw and the saturation partial pressure is given by pw,0, so that the water activity of a solution that is in equilibrium with the air moisture above the solution.
Hydrated salts[edit]
Some salts may crystallize both as anhydrous as well as hydrated phase with one or more water molecules, the latter being embedded into the crystal structure. Mirabilite Na2SO4∙10H2O forms from the system Na+-SO42--H2O and crystallizes with ten water molecules embedded in the crystal, with a ratio of one mole Na2SO4 to ten moles H2O. A hydration reaction can be postulated similarly to a solubility reaction:
Mν,MXν,X•ν0,AH2O+(ν0,B-ν0,A)H2O(g) ⇌ Mν,MXν,X•ν0,BH2O (Eq. 4)
where ν0,A corresponds to the number of water molecules in the lower hydration phase and ν0,B corresponding to the higher hydration phase. The equilibrium constant for the hydration reaction KH can be formulated as follows:
KH=pw0/pw,AB=1/RHAB (Eq. 5)
The saturation partial pressure, or deliquescence, pw0 will be in equilibrium with the water vapor pressure of the lower (A) and the higher (B) hydration phase pw,AB, from where the reciprocal value of the relative humidity (RH) in equilibrium with both phases, A and B, is given by
RHAB. When the RH increases above that for RHAB hydration of the salt will occur, while if the RH decreases below that value, dehydration will occur. [Steiger.etal:2014]Title: Weathering and Deterioration
Author: Steiger, Michael; Charola A. Elena; Sterflinger, Katja [Steiger:2009a]Title: Modellierung von Phasengleichgewichten
Author: Steiger, Michael .
.
Phase diagrams[edit]
Salts with the general formula Mz+-Xz--H2O (where M corresponds to the cations, and X to the anions, where several ions can be included, some having different charges z) can result in the formation of different phases depending on the temperature and relative humidity (RH). In the phase diagrams the stability conditions for the different phases can be determined.
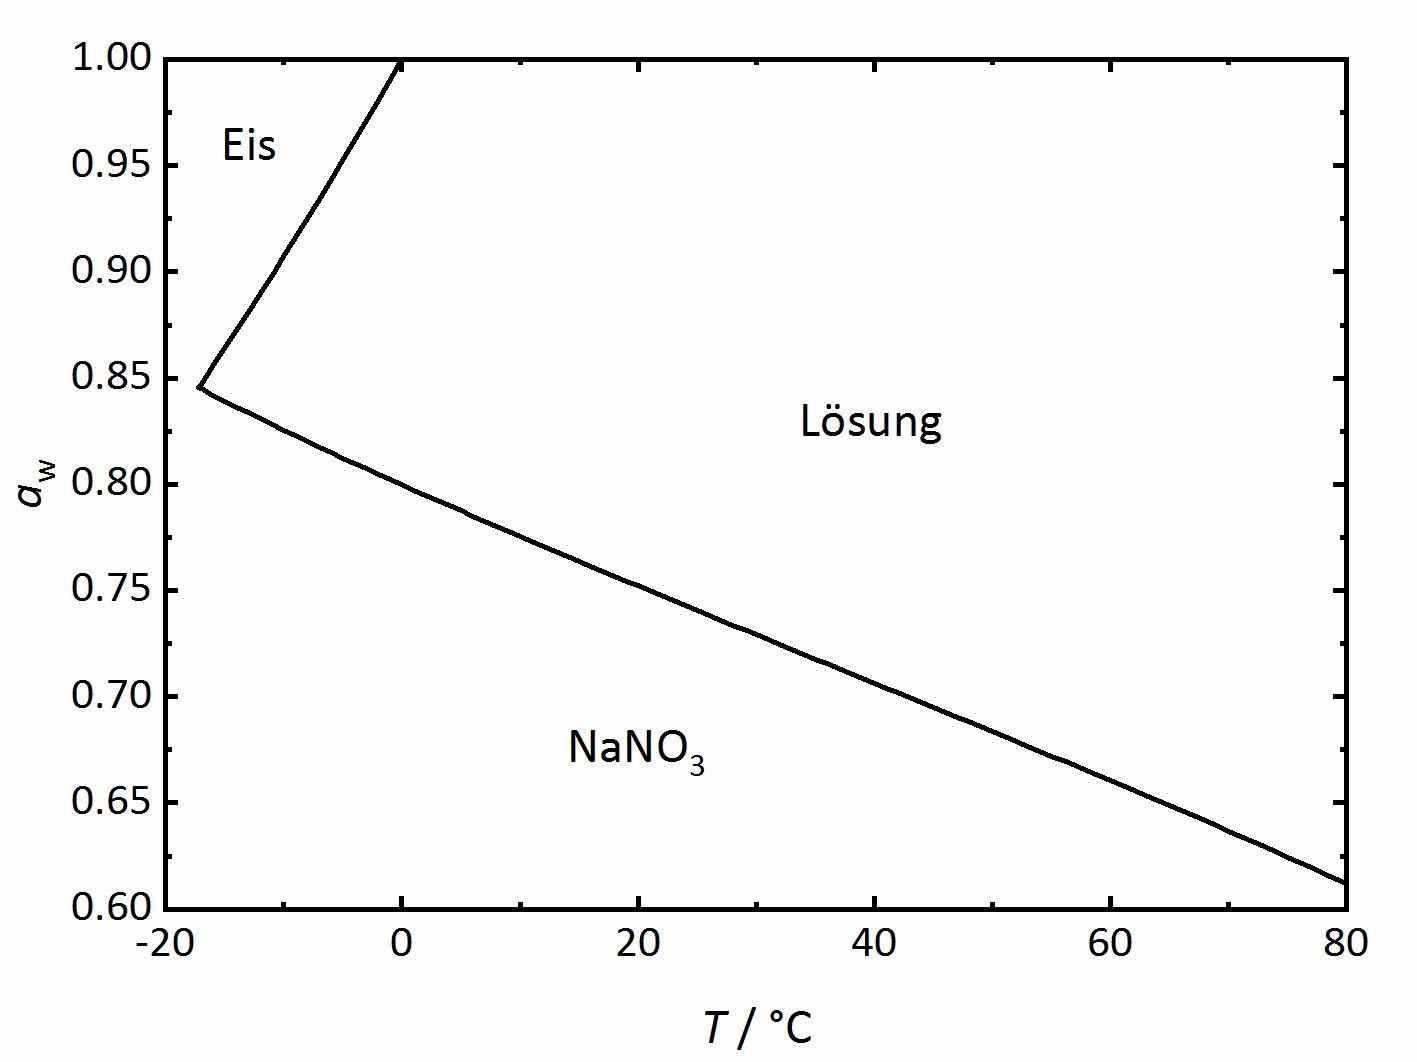
For the case of single salts that do not hydrate there is a specific relation between temperature and RH above which the salt will begin to absorb water vapor from the air to form a saturated solution. This point is defined as the deliquescence relative humidity (DRH), where the crystalline phase, the saturated solution and the water vapor above it are in equilibrium thus corresponding to the water activity of the solution. In the phase diagram for sodium nitrate shown in (Figure 2) it can be seen that the DRH corresponds to a temperature of 20°C and 75.3 % RH. The diagram also shows that the DRH will decrease with increasing temperature. Above the line, corresponding to the saturated salt solution it can be seen that with increasing RH and at a given temperature the ongoing water vapor absorption will diluted the solution. On the other hand, with decreasing RH, the solution will concentrate as water vapor is released into the environment, until the salt reprecipitates upon reaching the DRH value. How much water will be absorbed above the DRH depends on the equilibrium between solution and water vapor in the environment, i.e. RH. In equilibrium, the water activity of the solution will correspond to the RH of the environment (Equation 3). If moisture is lost, the system will absorb more water vapor from the environment so that equilibrium is restored.
Author: Steiger, Michael; Kiekbusch, Jana; Nicolai, Andreas

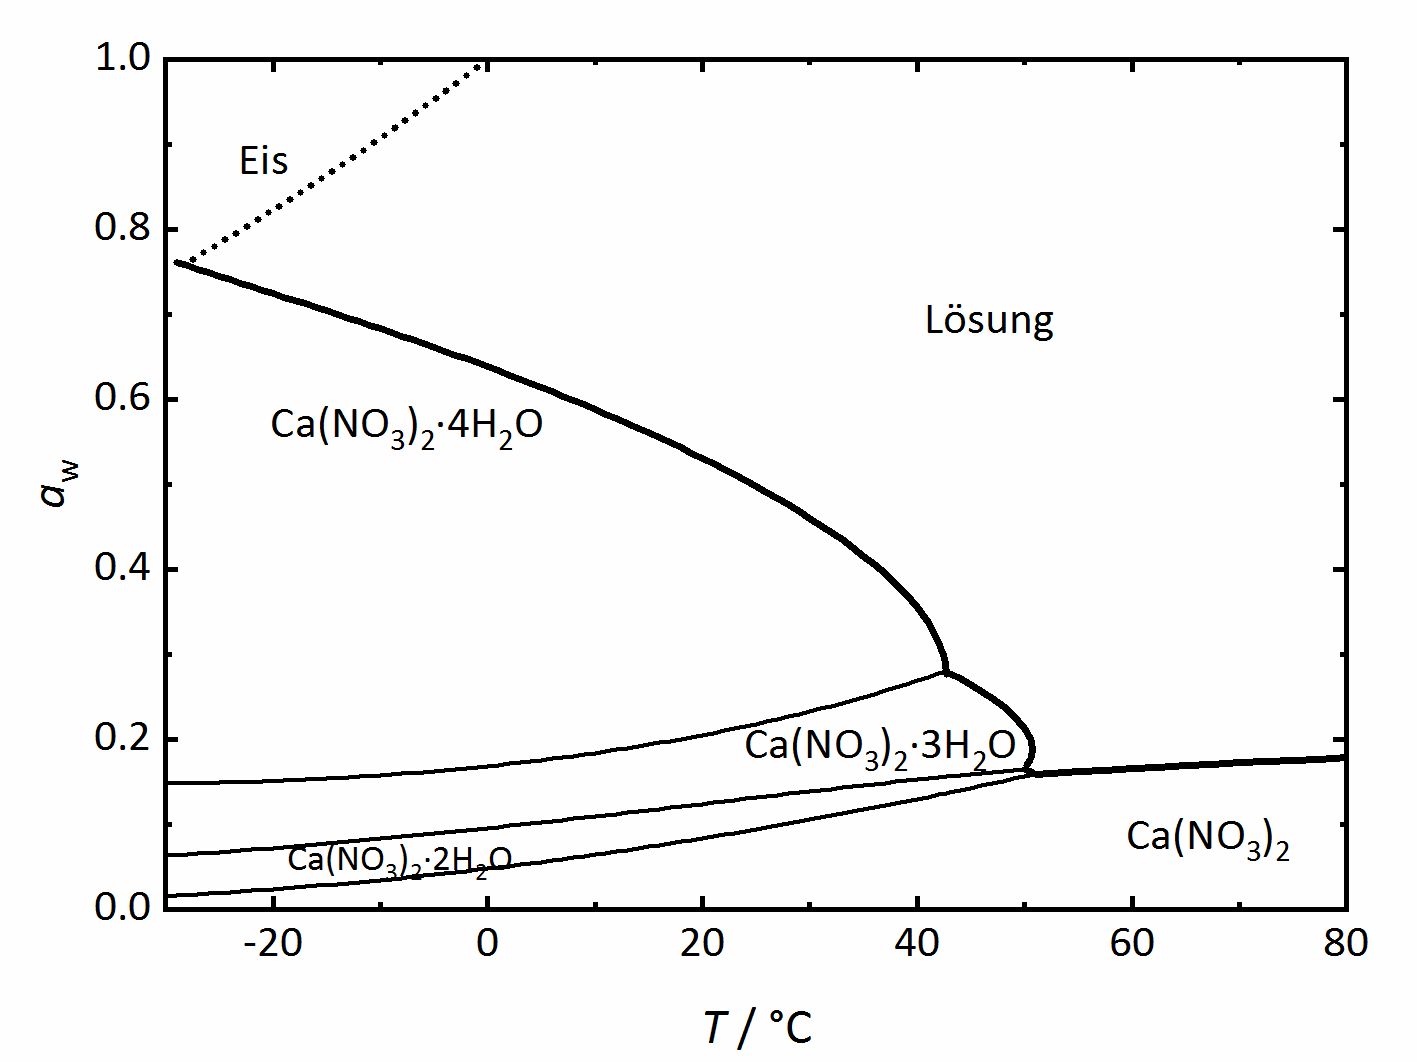
Apart from single salts, there are many salts which may have different hydrate phases. A relatively simple phase diagram to illustrate such a system is that corresponding to Ca2+-NO3--H2O (Figure 3). In this case, three different hydration phases can be found apart of the anhydrous one. Similarly to the DRH that reflects the point where the salt will start to absorb water vapor to form a saturated solution, there is in this case a RH value where the anhydrous salt will absorb water to form a hydrated phase, and if more hydration phases can form, there will be various such points. The phase diagram shows the different hydration phases that the salt can form. Different lines will show their stability areas. The different DRH for the hydrates are shown by the thicker drawn lines, and they describe the equilibrium between the crystalline salt, the saturated solution and the water vapor in the air. There are also other thinner lines that describe the phase changes between the various hydration-dehydration equilibria between the lower and higher hydration phases. It is also important to consider the formation of ice, which is shown by the dotted line. Thus, at temperatures below 0°C, the equilibrium with ice needs also to be considered together with that of the tetrahydrate calcium nitrate (Nitrocalcite) [Steiger.etal:2014]Title: Weathering and Deterioration
Author: Steiger, Michael; Charola A. Elena; Sterflinger, Katja .
.
Phase diagrams for salts having several hydrates can be even more complex, so another example will be given for the system
Na+-SO42--H2O [Steiger.etal:2008]Title: Crystallization of sodium sulfate phases in porous materials: The phase diagram Na2SO4–H2O and the generation of stress
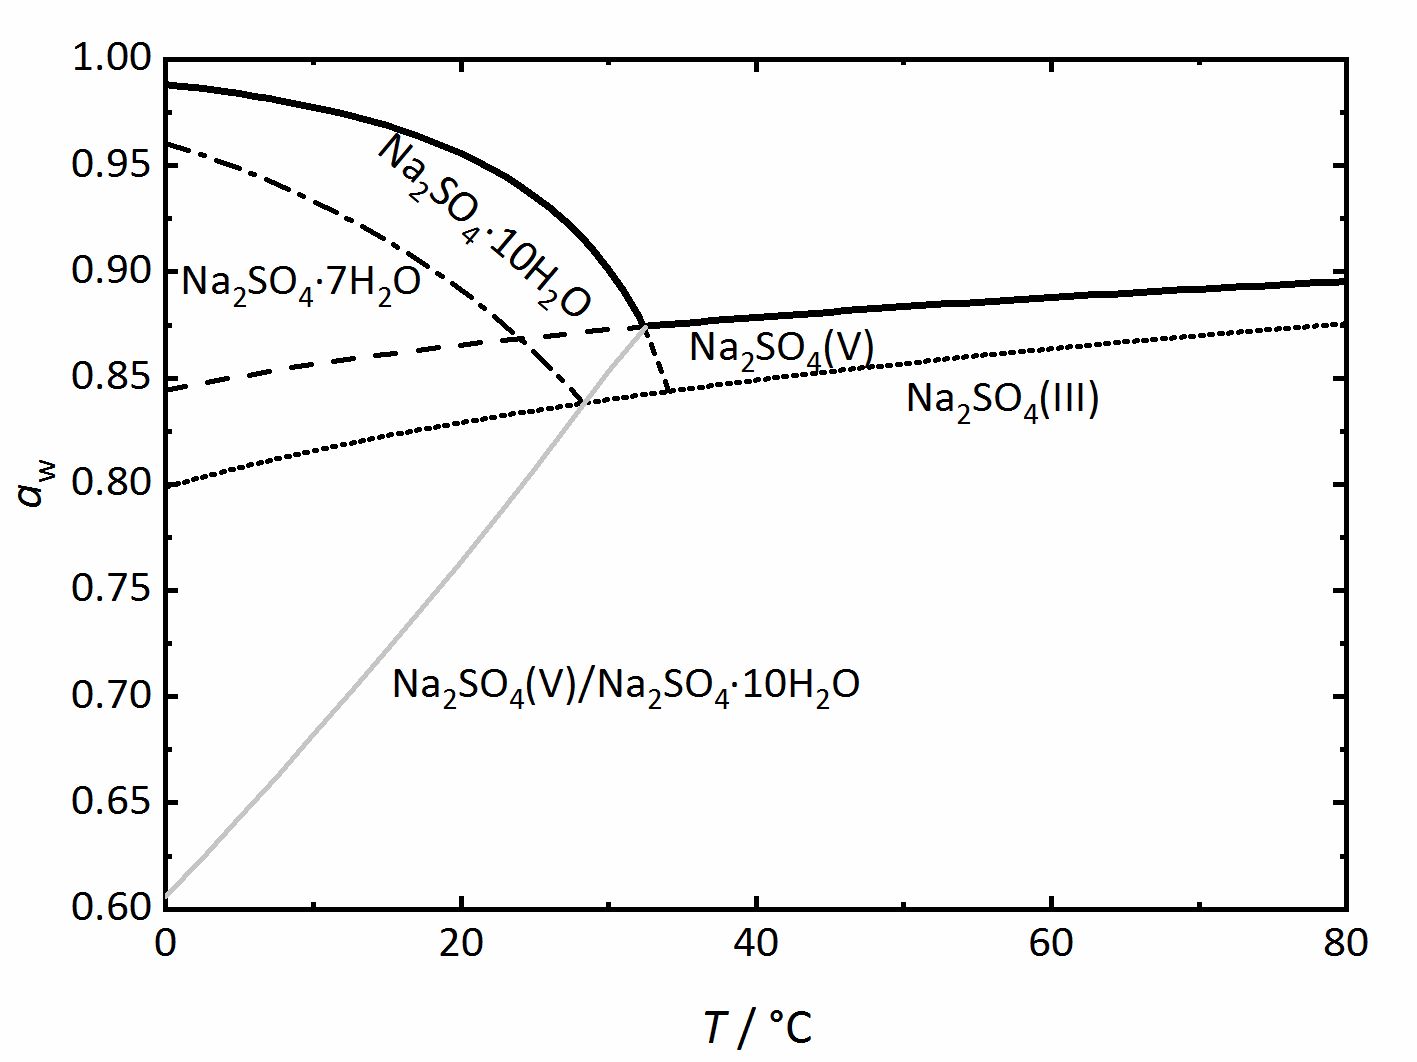
Author: Steiger, Michael; Asmussen, Sönke (Figure 4). Again, thicker lines show the equilibrium between the saturated solution and the crystalline phase in question, corresponding to the DRH value. They grey line represents the dehydration or the hydration equilibrium between the anhydrous phase (Thenardite) and the decahydrate (Mirabilite). Mirabilite and Thenardite are not stable at all temperatures, so that the transition temperature of 32.4°C can easily be seen. Above this temperature, Mirabilite is no longer a stable phase, while under it Thenardite is no longer thermodynamically stable and this is differentiated by the dashed-lines. Other dashed or dot lines reflect the phase limits for the sodium sulfate-heptahydrate as well as the phase III anhydrous sodium sulfate. These lines are the main difference to the previously shown diagrams. They represent metastable phases or regions. This means that these phases are not thermodynamically stable, but they can still form depending on the reaction kinetics. Although Thenardite or Mirabilite are the
thermodynamically stable phases, the metastable heptahydrate and phase III can form depending on cooling or evaporation of the solutions and their possible formation should not be forgotten (for example,[Espinosa.etal:2008]Title: Model for the mechanical stress due to the salt crystallization in porous materials
Author: Espinosa, R.; Franke, L.; Deckelmann, G. [Genkinger.etal:2007]Title: Crystallisation of sodium sulfate: supersaturation and metastable phases
Author: Genkinger, Selma; Putnis, Andrew [Grossi.etal:2013]Title: Acoustic emission monitoring to study sodium sulphate crystallization in monumental porous carbonate stones
Author: Grossi, C.M.; Esbert, R.M.; Suarez del Rio, L.M.; Montoto, M.; Laurenzi-Tabasso, M. [Linnow.etal:2006]Title: Investigation of Sodium Sulfate Phase Transitions in a Porous Material Using Humidity- and Temperature-Controlled X-ray Diffraction
Author: Linnow, Kirsten; Zeunert, Anke; Steiger, Michael [Xu.etal:1999]Title: In-situ Raman observations of phase transformation of Na2SO4 during the hydration/dehydration cycles on single levitated microparticle.
Author: Xu B., Schweiger G. ).
).
Author: Steiger, Michael; Asmussen, Sönke

With regards to highly hygroscopic salts, such as calcium nitrate or calcium chloride their phase diagrams do not show conditions for the formation of metastable phases, however, they are relevant. The equilibrium border between solution and crystallized salt provides the point at which the salt should crystallize out from the saturated solution; however, these saturated salt solutions may become supersaturated and therefore the solution will be below the DHR as a metastable solution [Steiger:2009a]Title: Modellierung von Phasengleichgewichten
Author: Steiger, Michael .
.
Salt mixtures[edit]
In most objects of cultural heritage mixtures of various ions, and therefore various salts, can be found, complicating the problem. It is not as easy to foretell their behaviour under given climatic conditions as it is for single salts, where the deliquescence humidity (DRH) and hydration equilibrium can be determined from the phase diagram. The various salts in the mixture influence their respective solubilities, so that their characteristic saturation RH are not the same. Thus, it is impossible to determine at what specific temperature the salt will start to deliquesce. For salt mixtures, rather than a single point there will be a temperature range for which the various phases can crystallize out of the mixtures. The influence of other salts on a specific one such as Mν,MXν,X∙nH2Oν,X∙nH2O can be given according to the thermodynamic solubility product (Eq. 2). A second salt that contains one of the ions of the first one will also influence its solubility (mM may change to mX), an even if this does not happen, nonetheless will γM and γnX be influenced [Steiger.etal:2014]Title: Weathering and Deterioration
Author: Steiger, Michael; Charola A. Elena; Sterflinger, Katja . An example for a mixture of two salts, where in one case they both have one ion in common, and in the other they do not have any ion in common.
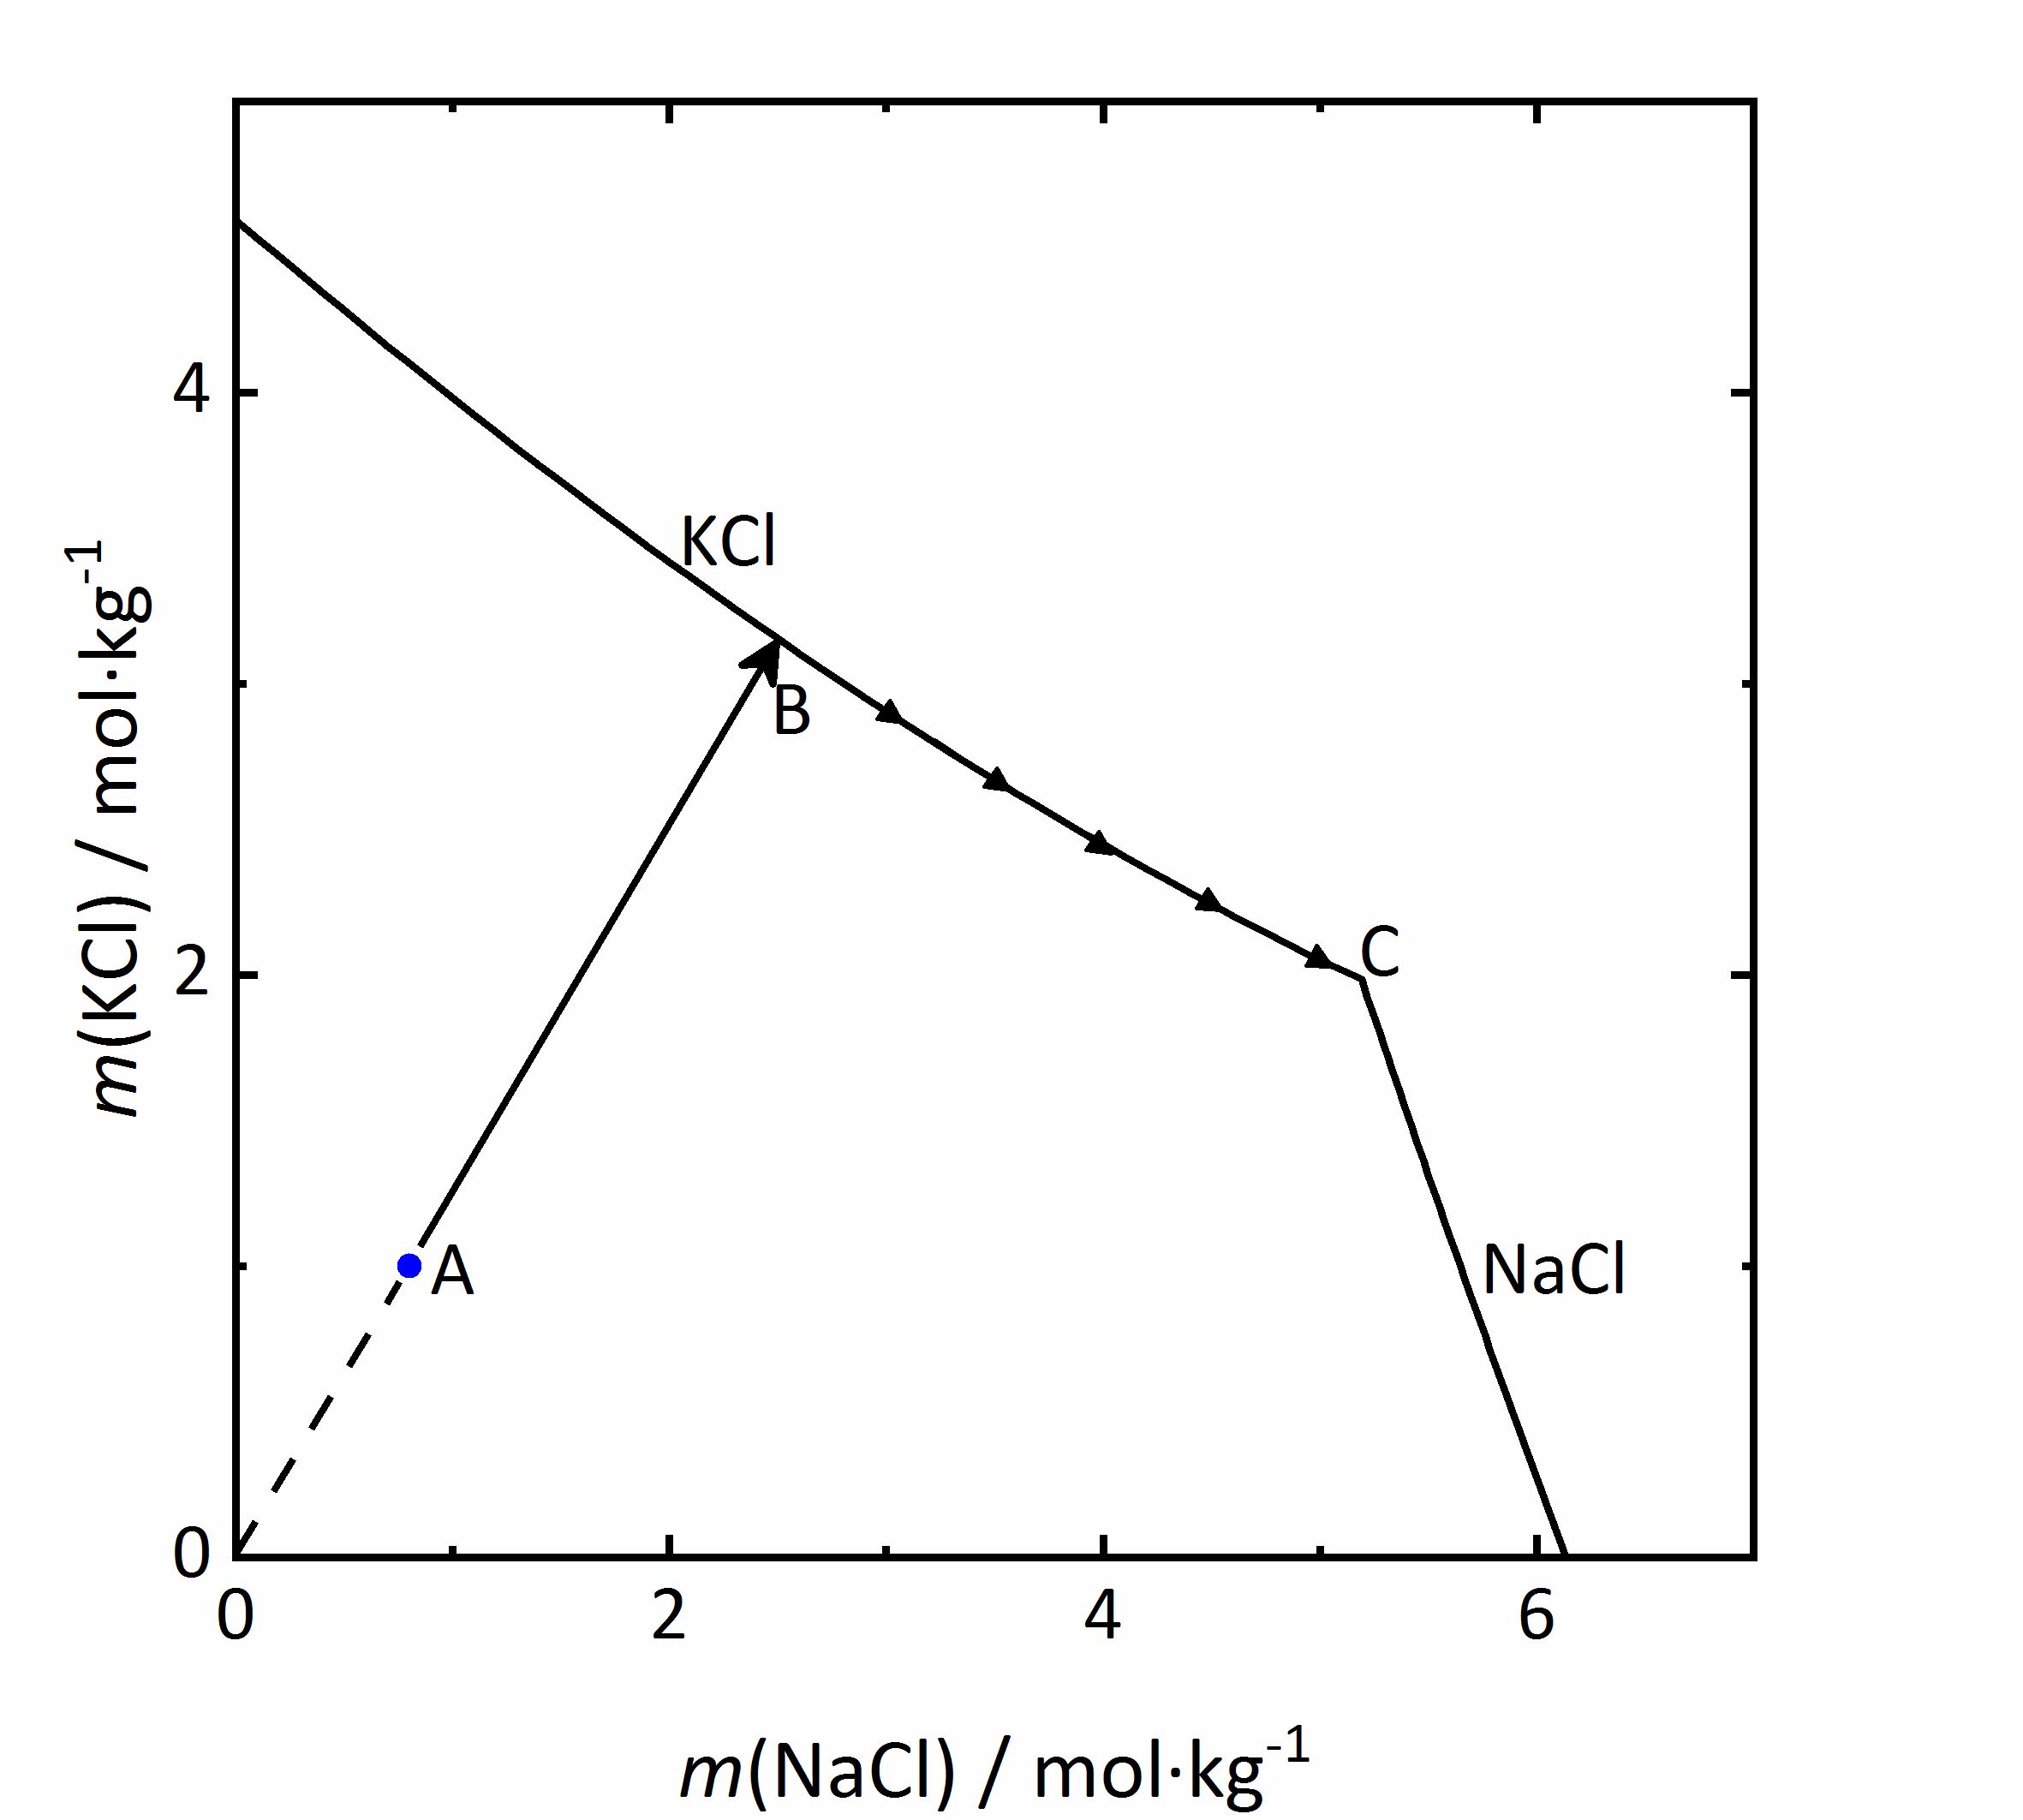
As an example of a same ion salt mixture, the system KCl-NaCl-H2O will be considered. The diagram in Figure 5 shows the molality of KCl with respect to that of NaCl. Because both salts contain choride ions, will the mX of the salts be influenced (see Eq. 1). If the concentration of the second salt increases, so will the chloride concentration in the mixture, and this will reduce the solubility of the first salt. If a solution with the composition marked as A in the diagram, evaporation of water will concentrate the solution following the line AB. At point B, saturation with regards to KCl would be achieved, so that this salt would crystallize out. If evaporation continues, the crystallization of potassium chloride will modify further the composition of the solution, and the crystallization process will continue at point; KCl will crystallize along its solubility curve, so that the potassium concentration decreases, while the sodium chloride increases. The crystallization end point C is reached when the saturation is attained also for NaCl, so that further evaporation leads to crystallization of both phases and drying out of the solution [Steiger:2009a]Title: Modellierung von Phasengleichgewichten
Author: Steiger, Michael .
.
Author: Steiger, Michael
 .
.
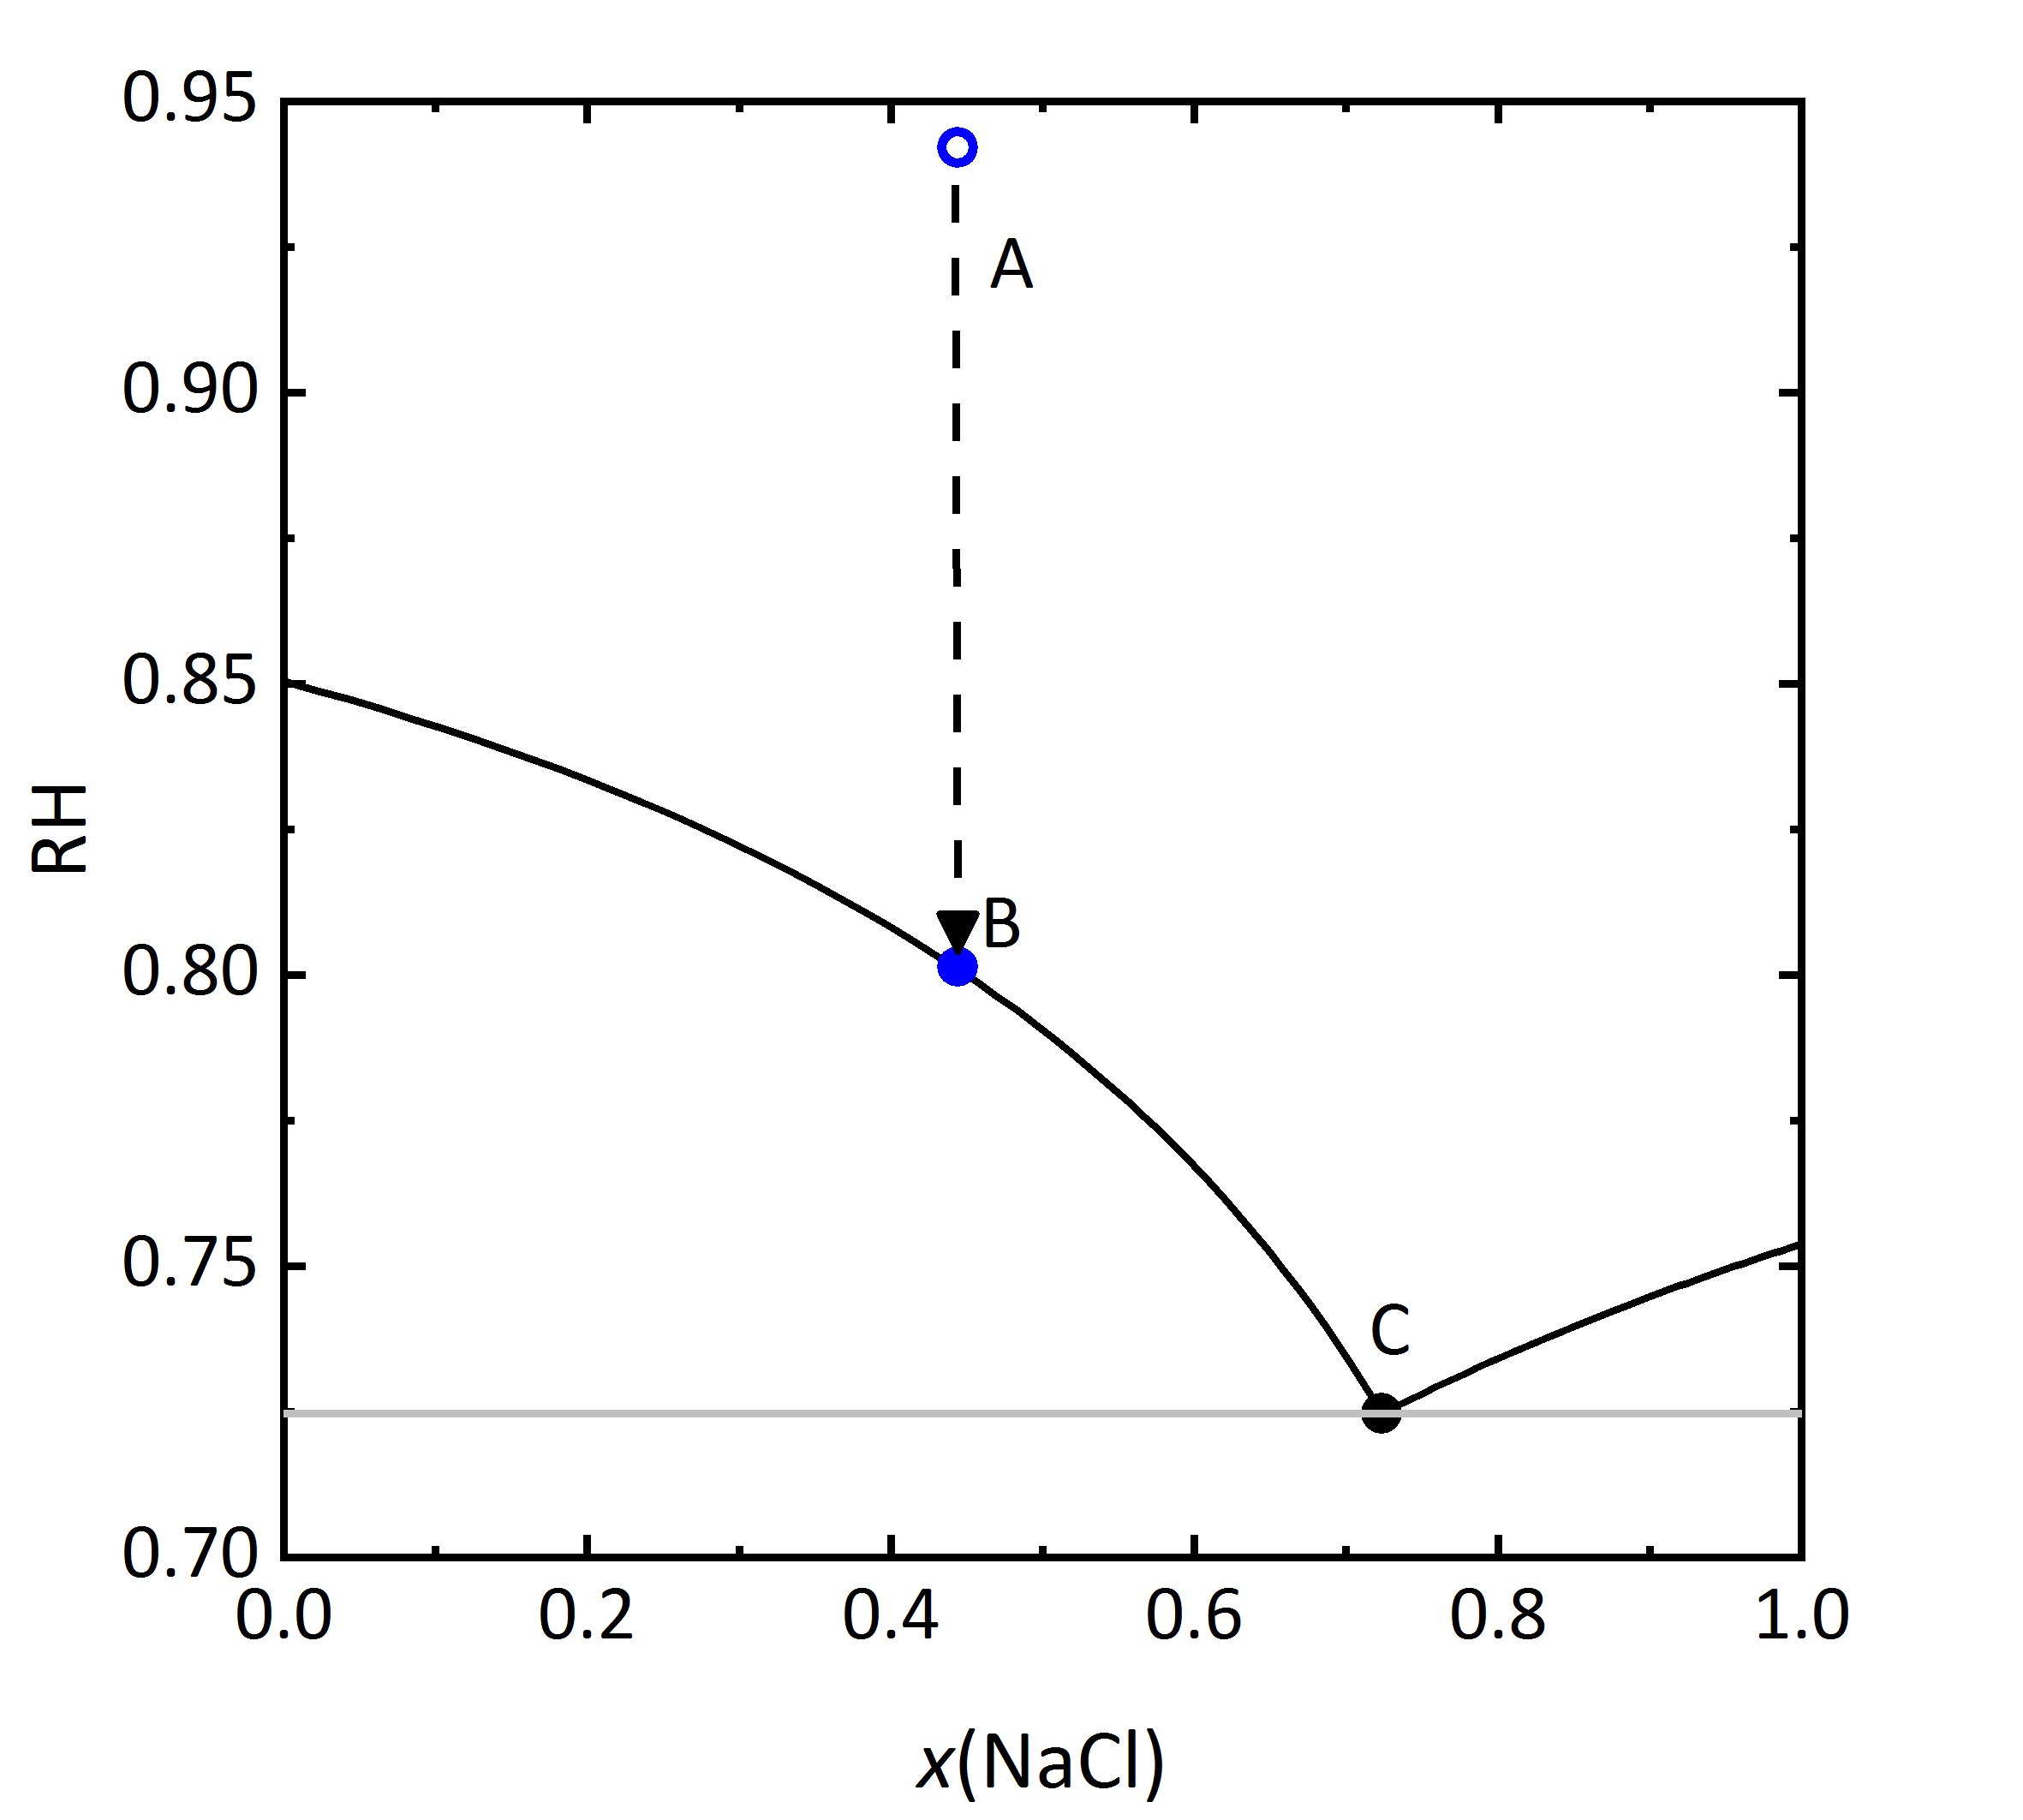
The diagram shown in Figure 6 plots the RH as a function of the composition of the solution, where it can be seen that the saturation RH is also influenced when the salt is in a mixture; the equilibrium RH of the saturated solutions are also indicated. The composition, i.e., concentration of the solution is given in Mole-fraction of sodium chloride in relation to the mixtue of all components. For lower concentrations, the amount of potassium chloride will be more important, by a 0.5 mixture, the same molal concentration for potassium and sodium chloride will be found. Point A in the diagram reflects a specific composition that has a specific RH that for this solution corresponds to 94.2% RH. Should the solution evaporate, the saturation point B will be reached, which corresponds to the saturation with respect to KCl, and this corresponds to an 80.1% RH. The DRH of KCl by itself corresponds to 85% RH at 20ºC, so that when in a mixture, the crystallization of this salt will only occur at lower RH. This point could also be considered the equilibrium moisture, but also the saturation moisture for point B. If the RH continues to decrease, when it reaches the 72.5% RH the final crystallization point will be reached. Similarly to points A, B, and C, if one starts with a concentration of sodium chloride >0.73 is can be seen that in this case the crystallization will start with sodium chloride at lower humidity than the DRH of the single salt. The diagram also shows a single (critical) value where the crystallization of the salt starts, should the mixture not be sufficient. In this area of RH, the cristallization process will be continuous [Steiger.etal:1996]Title: Crystallization properties of salt mixtures: Comparison of experimental results and model calculations
Author: Steiger, Michael; Zeunert, Anke [Price.etal:1994]Title: Preventing salt damage in porous materials
Author: Price, Clifford A.; Brimblecomb, Peter [Steiger.etal:1995]Title: Hygroskopische Eigenschaften und Kristallisationsverhalten von Salzgemischen
Author: Steiger, Michael; Dannecker, Walter . The upper limit of this area will be defined by the original composition of the mixture. The lower RH limit corresponds to the final crystallization point, when both phases will be present in the crystallized material. The value of this lower limit has also been referred to as mutual deliquescence humidity or MDRH, as it gives the RH value at which a mixed salt solution is in equilibrium with the crystalline salts [Steiger.etal:2014]Title: Weathering and Deterioration
Author: Steiger, Michael; Charola A. Elena; Sterflinger, Katja .
.
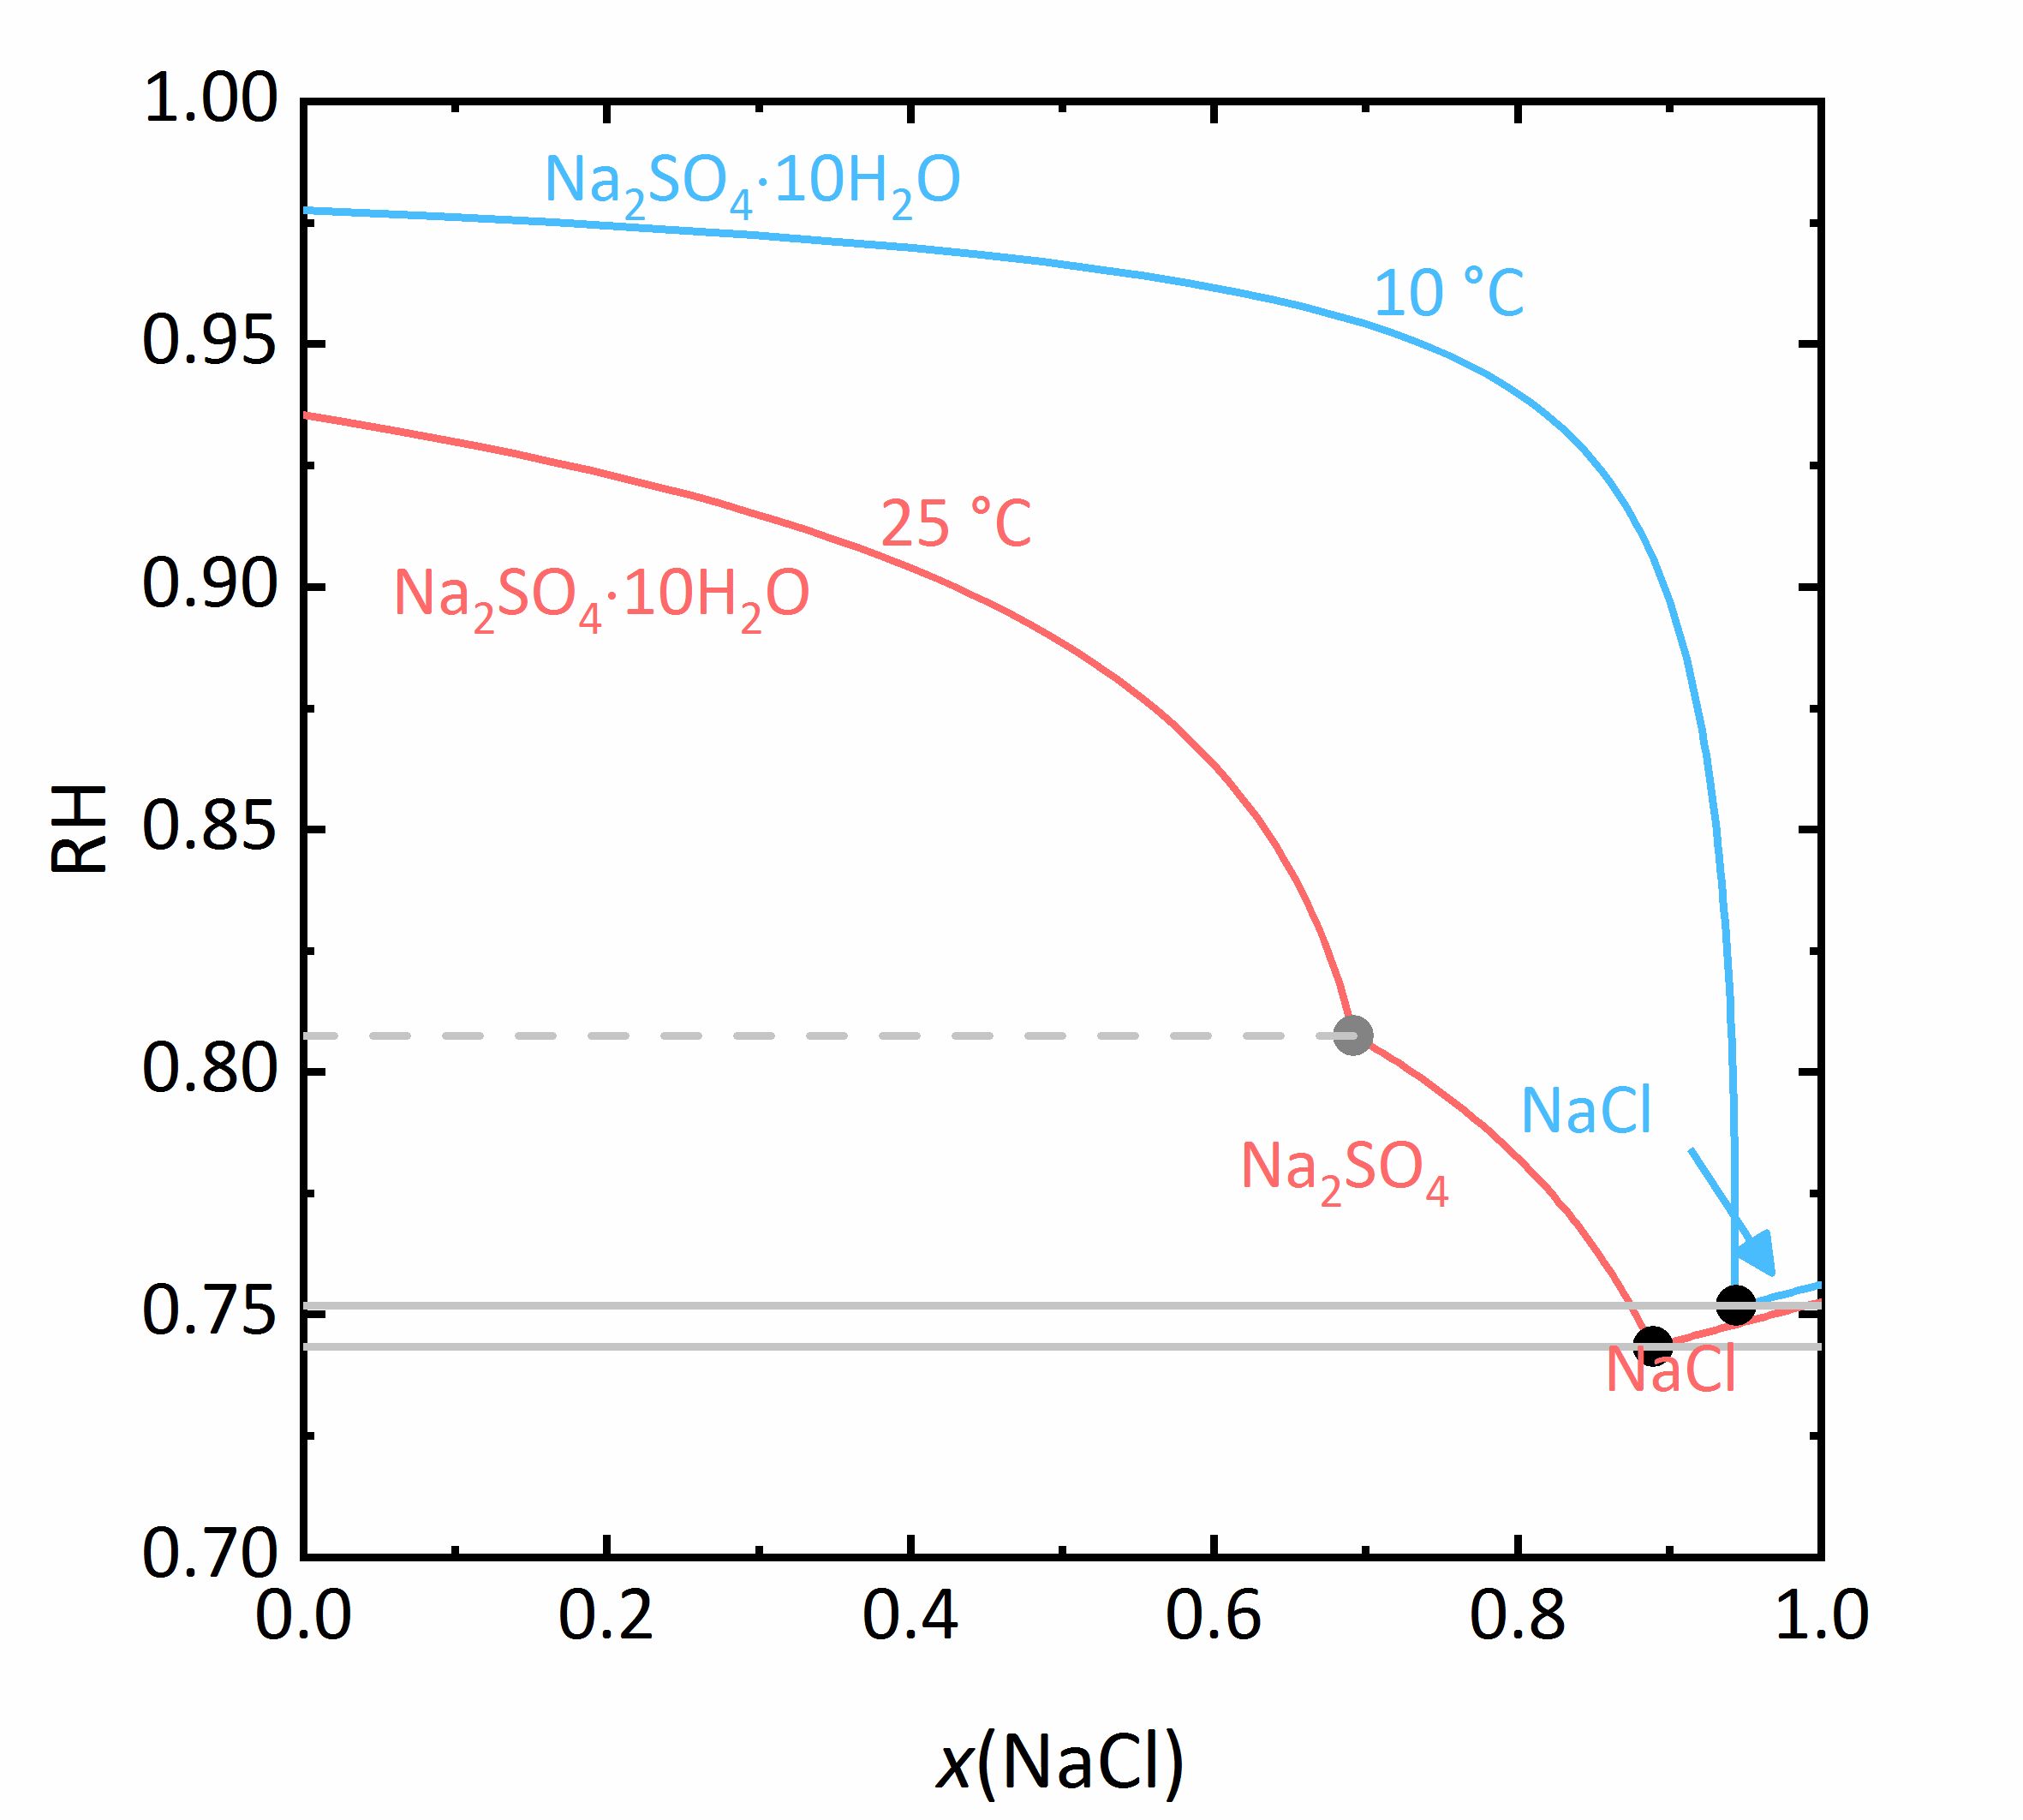
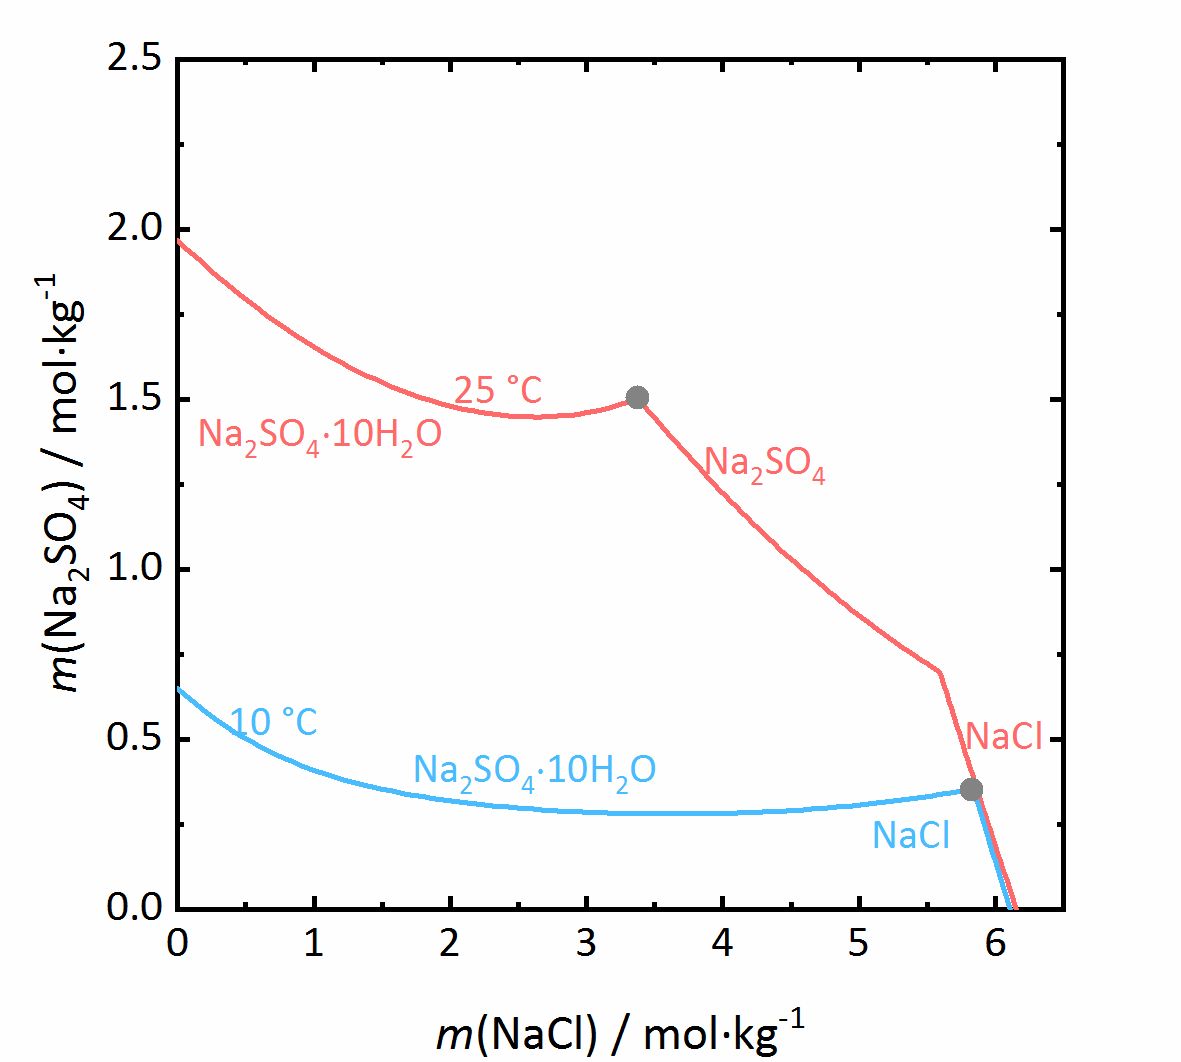
The next example shows a more complicated behaviour of salt mixtures in which there may be a salt that may crystallize in two or more degrees of hydration. In this case, the activity coefficient will be influenced as well as the water activity. For example, Figure 7 shows a mixture of NaCl-Na2SO4-H2O. It can be seen that the solubility of Mirabilite to which a high concentration of sodium chloride was added increases although the cation is the same. Since the water activity of the solution decreases with increasing concentration (i.e., evaporation of water), the solubility of the hydrated salt increases after a short initial decrease such as shown in the solubility diagram (Figure 4) at 10ºC. The dehydration equilibrium for the system Thenardite-Mirabilite is highly dependent on the temperature as well as on the water activity. At temperatures below 18ºC, this dehydration will not occur, since the RH for the dehydration (grey line in the phase diagram of Na2SO4 in Figure 4, and for the mixture at 25ºC the grey dashed line in Figure 8) as the deliquescence humidity of the mixture falls below this value. Only when the equilibrium moisture of the reaction is higher than the deliquescence humidity can the dehydration or rehydration occur in the presence of the solution. The correlation between the water activity and the dehydration equibrium, the dehydration of Mirabilite in the presence of other salts can occur at lower temperatures, however, Thenardite in a Na+-SO42--H2O system, is not thermodynamically stable. This is an important consideration for the case real situations, since hydration in the presence of a solution will be easier, since hydration reactions will occur faster as compared to those in presence of only water vapor, thus accelerating the deterioration of materials. This issue is more relevant for more hygroscopic salt mixtures, since the deliquescence moisture of the mixture will have smaller values while the equilibrium moisture of the Mirabilite-Thenardite-conversion will occur more often. It is to be considered, that the values of the equilibrium moisture for this transformation are not influenced by other salts. A decisive point is whether the values of the transformation fall above or below the deliquescence humidity of the mixture [Steiger.etal:2014]Title: Weathering and Deterioration
Author: Steiger, Michael; Charola A. Elena; Sterflinger, Katja .
.
Author: Steiger, Michael; Charola A. Elena; Sterflinger, Katja
 .
.
Salt mixtures where a double salt may form[edit]
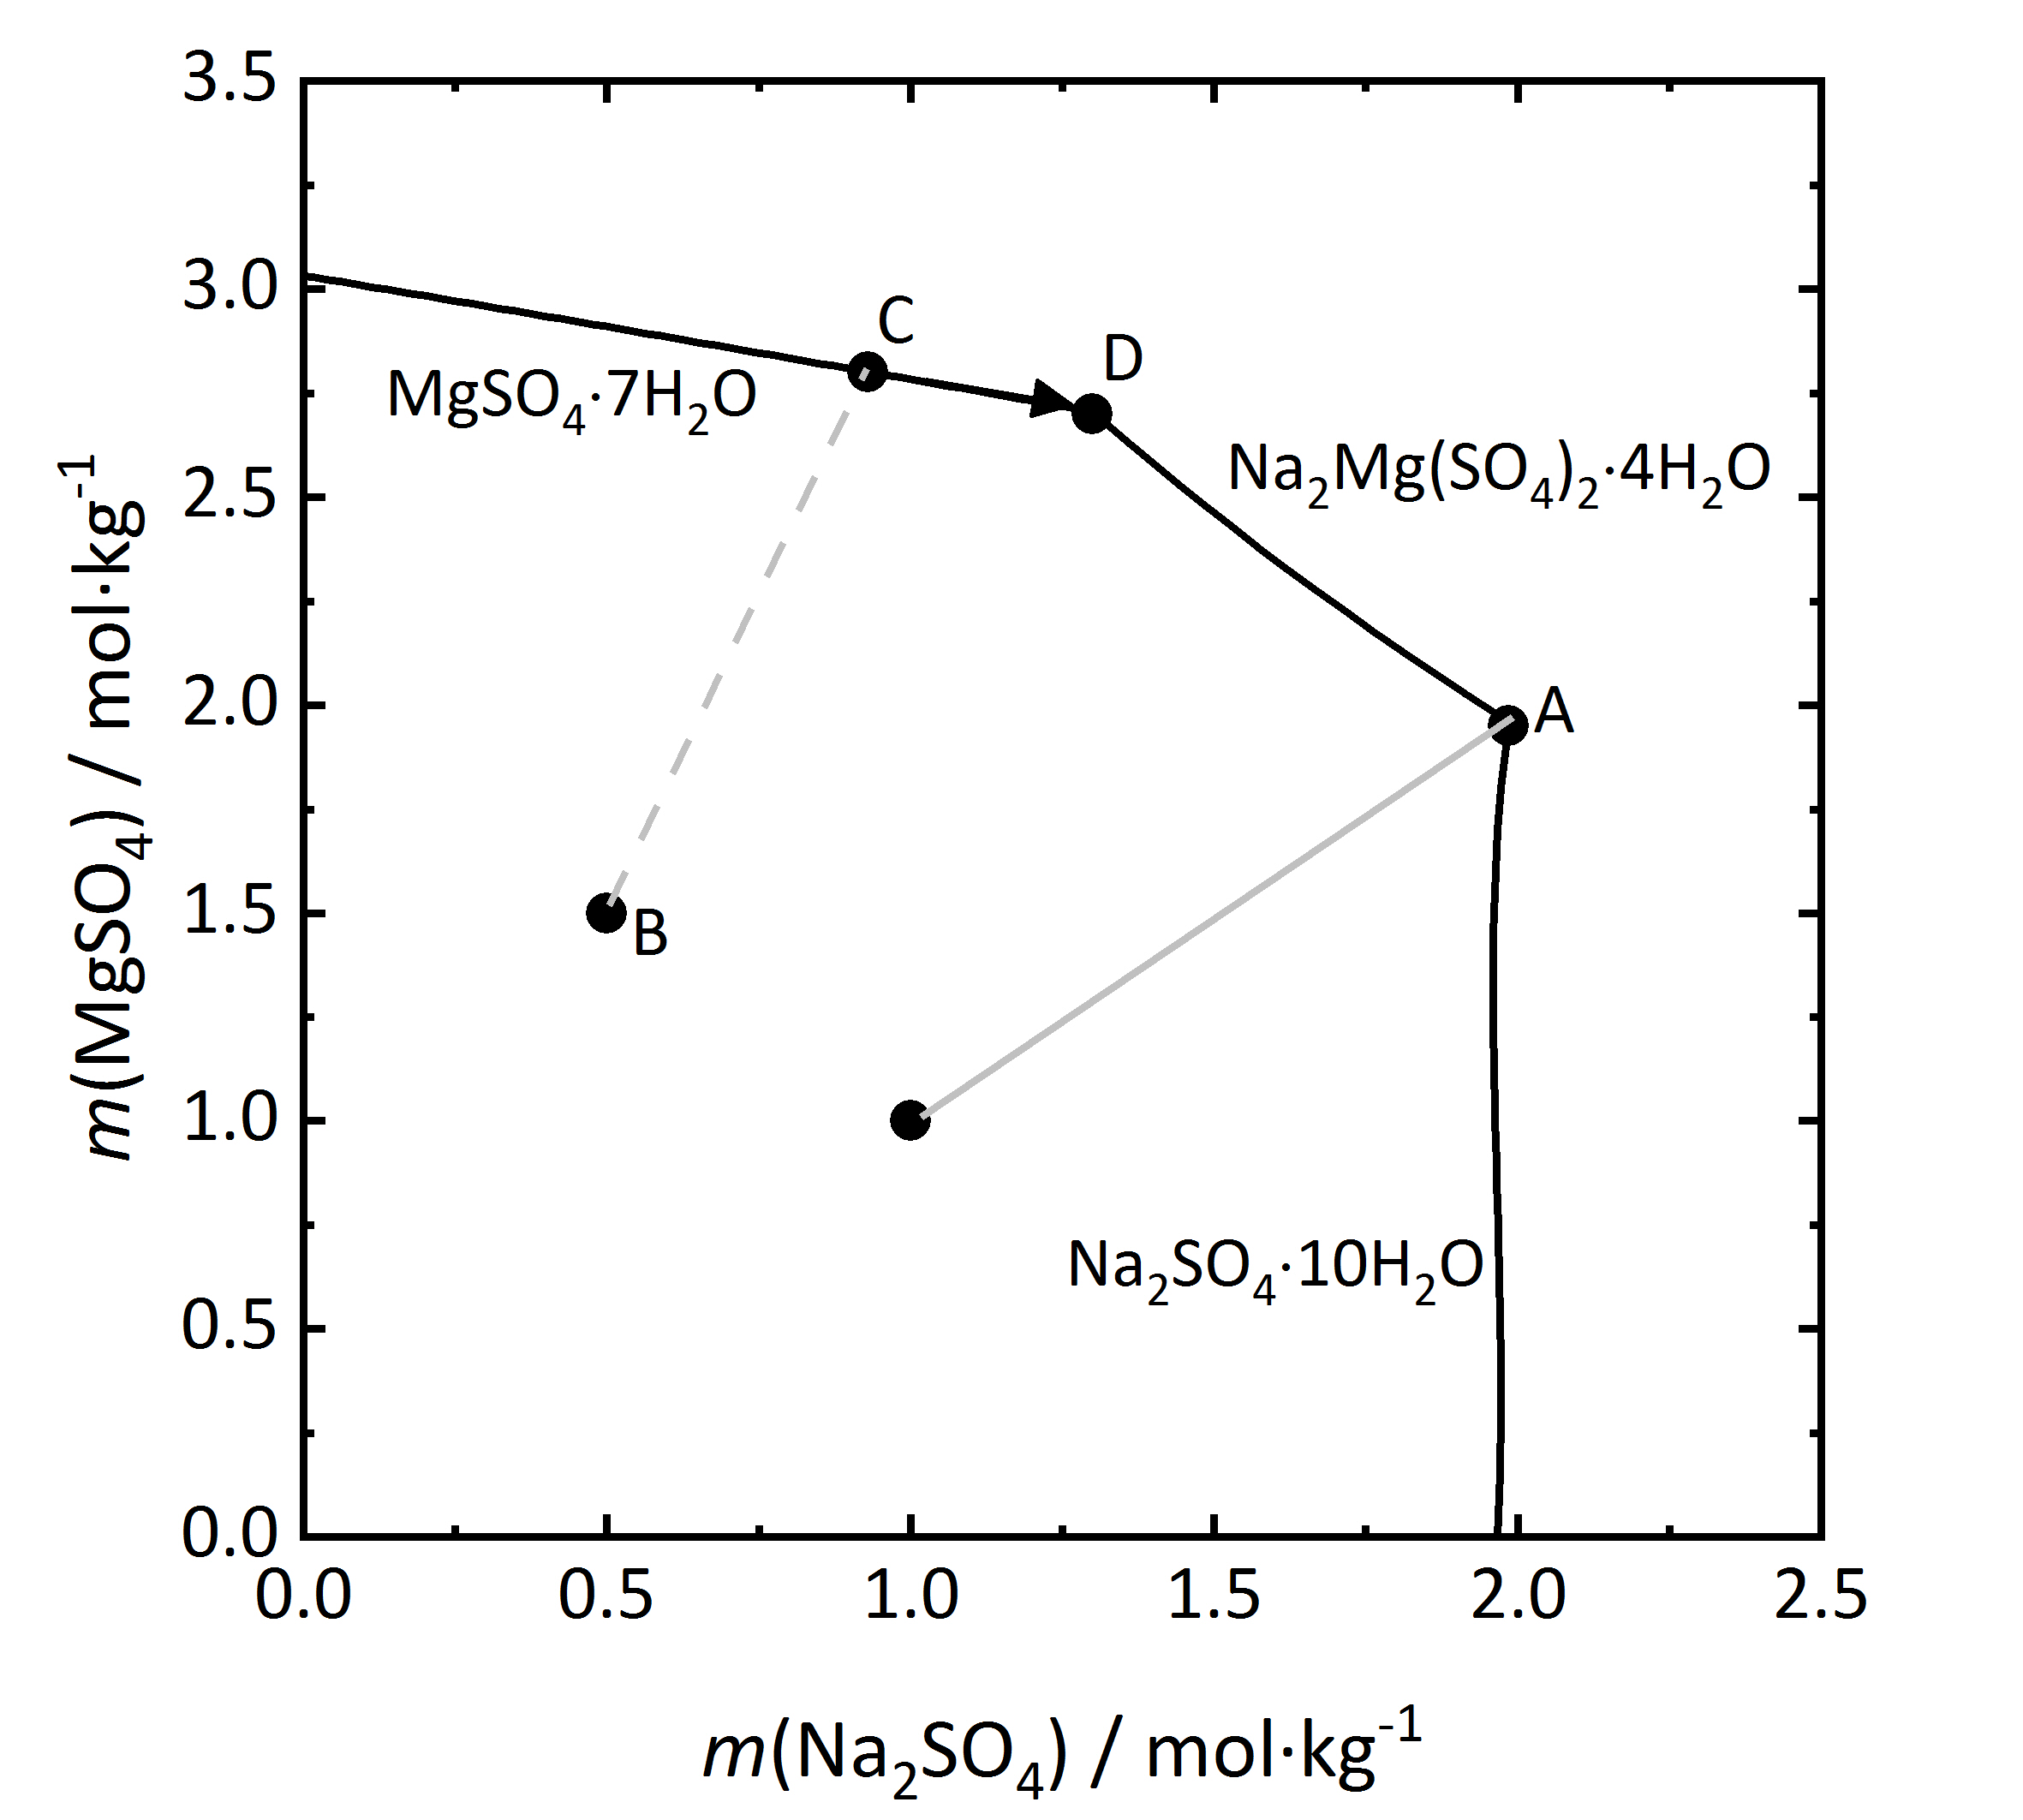
Die Betrachtung von Salzgemischen kann noch weiter ausgeführt werden. In vielen Salzmischungen können sich Doppelsalze bilden, also solche Salze, die drei oder mehr verschiedene Ionen enthalten. Wie bereits oben erwähnt, gibt es sowohl kongruent als auch inkongruent lösliche Doppelsalze. Zunächst soll ein Löslichkeitsdiagramm einer Mischung aus Na2SO4 und MgSO4 betrachtet werden (Abbildung 9), da sich in einem solchen Gemisch ein kongruent lösliches Doppelsalz (Astrakanit alias Blödit; Na2Mg(SO4)2∙4H2O) bilden kann. Auch hier sind wieder die Stoffmengenanteile der beiden beteiligten Einzelsalze gegeneinander aufgetragen, in diesem Fall bei einer Temperatur von 25 °C (die Phasen Na2SO4∙10H2O und MgSO4∙7H2O sind darauf zurückzuführen, dass sie bei dieser Temperatur in den jeweiligen Salzsystemen die stabilen Phasen darstellen). Da das Doppelsalz kongruent löslich ist, kristallisiert es aus Lösungen aus, die die gleiche Zusammensetzung haben wie das Salz selbst. Anhand der Summenformel des Salzes kann schon erkannt werden, dass es aus einer äquimolaren Mischung von Natrium- und Magnesiumsulfat auskristallisiert. Diese ist durch die hellgraue Linie im Diagramm dargestellt. Beim Erreichen der Sättigungskonzentration am Punkt A kristallisiert Blödit aus, wobei gleiche Mengen Natrium- und Magnesiumsulfat der Lösung entzogen werden. Im Verhältnis verändert sich die Lösungszusammensetzung nicht, so dass nur Blödit auskristallisiert und es sich somit wie ein Einzelsalz verhält. Ebenso ist es bei der Betrachtung des Deliqueszenzverhaltens. Liegt reines Blödit vor, so beginnt es ab seiner Sättigungsfeuchte Wasserdampf aus der Umgebung aufzunehmen und bildet zunächst eine gesättigt Lösung. Bei weiterem Anstieg der relativen Feuchte löst sich das Salz unter Bildung einer Lösung mit äquimolaren Anteilen Natrium- und Magnesiumsulfat wieder auf [Steiger.etal:2014]Title: Weathering and Deterioration
Author: Steiger, Michael; Charola A. Elena; Sterflinger, Katja . Wird hingegen von einer Mischung mit einem Überschuss an Magnesiumsulfat ausgegangen (Punkt B), so wird bei voranschreitender Verdunstung Magnesiumsulfat-Heptahydrat bei der entsprechenden Sättigungsfeuchte auskristallisiert (Punkt C). Die Kristallisation schreitet entlang C-D voran. Da im Verhältnis der Stoffmengenanteil von Natriumsulfat ansteigt, bildet sich Blödit an Punkt D (Endpunkt der Kristallisation).
Author: Steiger, Michael; Charola A. Elena; Sterflinger, Katja
 .
.
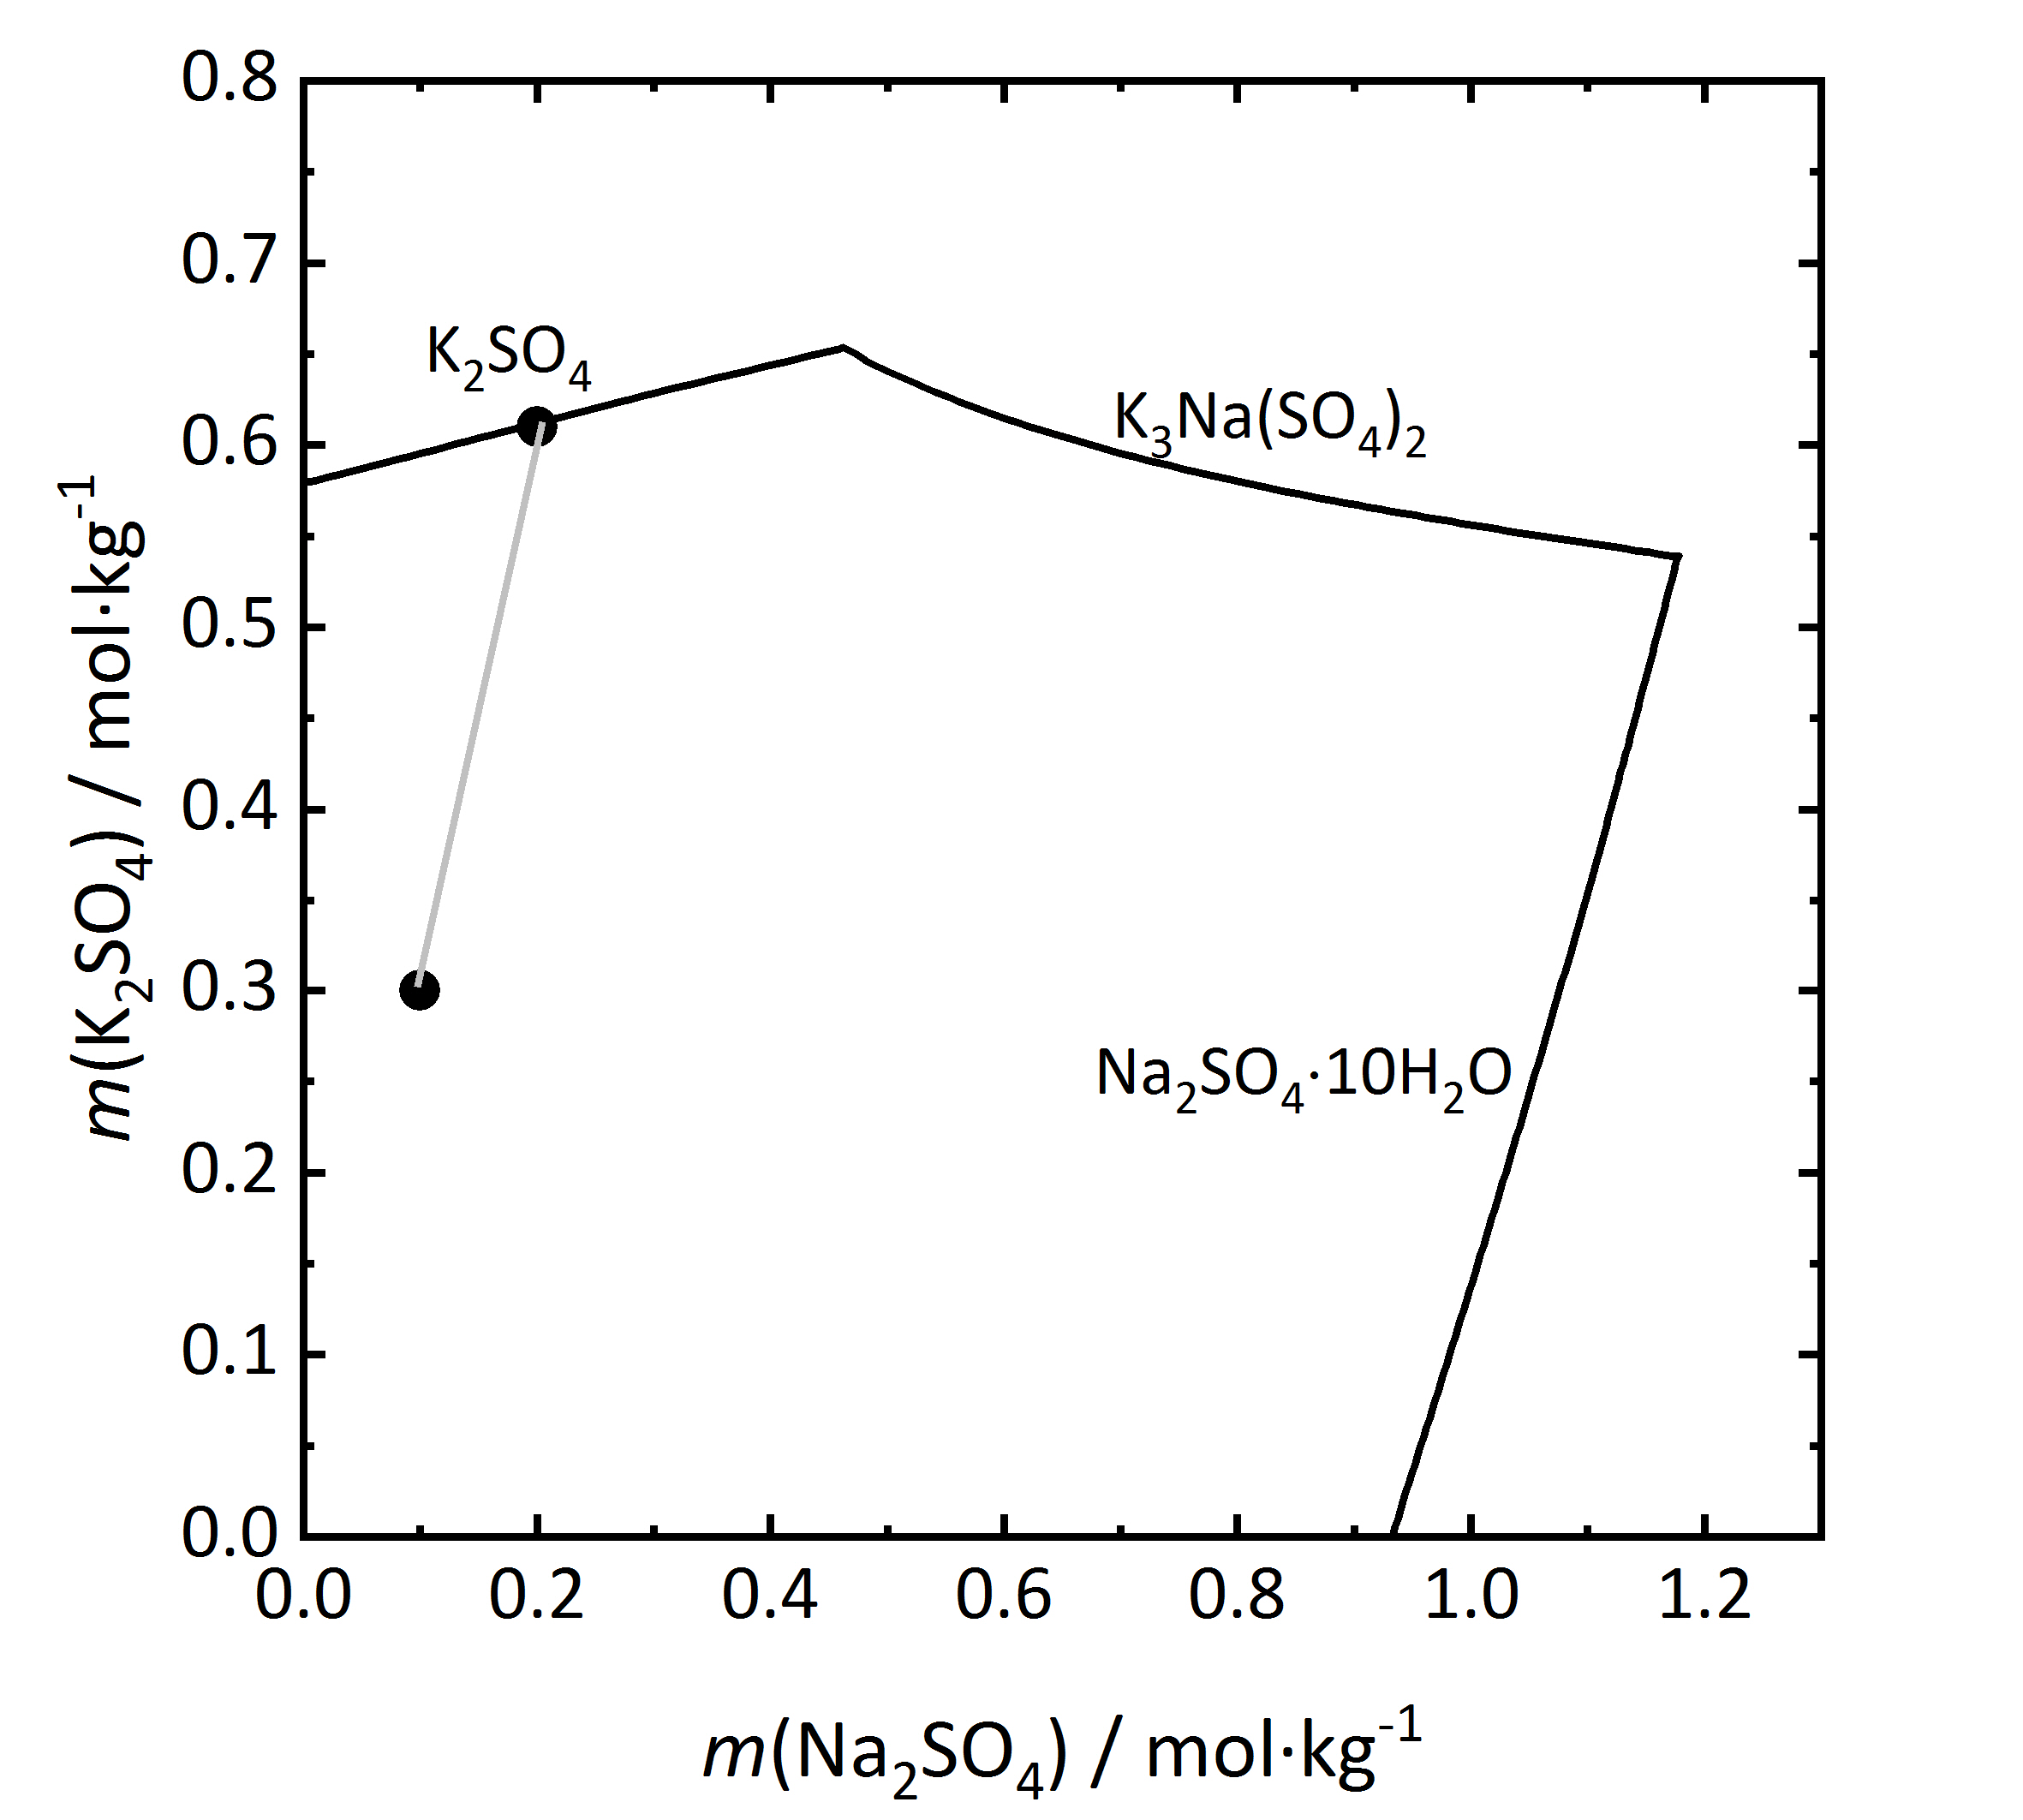
Als nächster Schritt soll in Abbildung 10 ein Löslichkeitsdiragramm eines inkongruent löslichen Doppelsalzes betrachtet werden. Aphthitalit (K3Na(SO4)2) besteht der Summenformel nach aus einer 3:1-Mischung (bezogen auf die Molalität) aus Kalium- und Natriumsulfat. Wird die Verdunstung einer Lösung mit einer solchen Zusammensetzung der Salze verfolgt (bei 15 °C), wird ersichtlich, dass Kaliumsulfat (Arcanit) auskristallisiert, jedoch nicht Aphthitalit. Es ergibt sich, dass eine in Bezug auf das Doppelsalz gesättigte Lösung in Bezug auf Arcanit übersättigt ist. Demnach würde es bei der Auflösung von Aphthitalit in Wasser nicht einfach zur Bildung einer gesättigten Lösung kommen, da Arcanit aufgrund der Übersättigung auskristallisieren würde [Steiger.etal:2014]Title: Weathering and Deterioration
Author: Steiger, Michael; Charola A. Elena; Sterflinger, Katja .
.
Author: Steiger, Michael; Charola A. Elena; Sterflinger, Katja
 .
.
Bislang wurden nur Salzmischungen mit drei verschiedenen Ionen betrachtet. Das Verhalten und auch die Darstellung von Mischungen mit vier verschiedenen Ionen werden dabei deutlich komplizierter. Hinsichtlich der Darstellung wird die Wasserkomponente zum Zweck der Übersichtlichkeit nicht mit dargestellt. Eine solche Darstellung wird auch als Jänecke-Projektion [Jaenecke:1906]Title: Über eine neue Darstellungsform der wässerigen Lösungen zweier und dreier gleichioniger Salze, reziproker Salzpaare und der van't Hoffschen Untersuchungen über ozeanische Salzablagerungen.
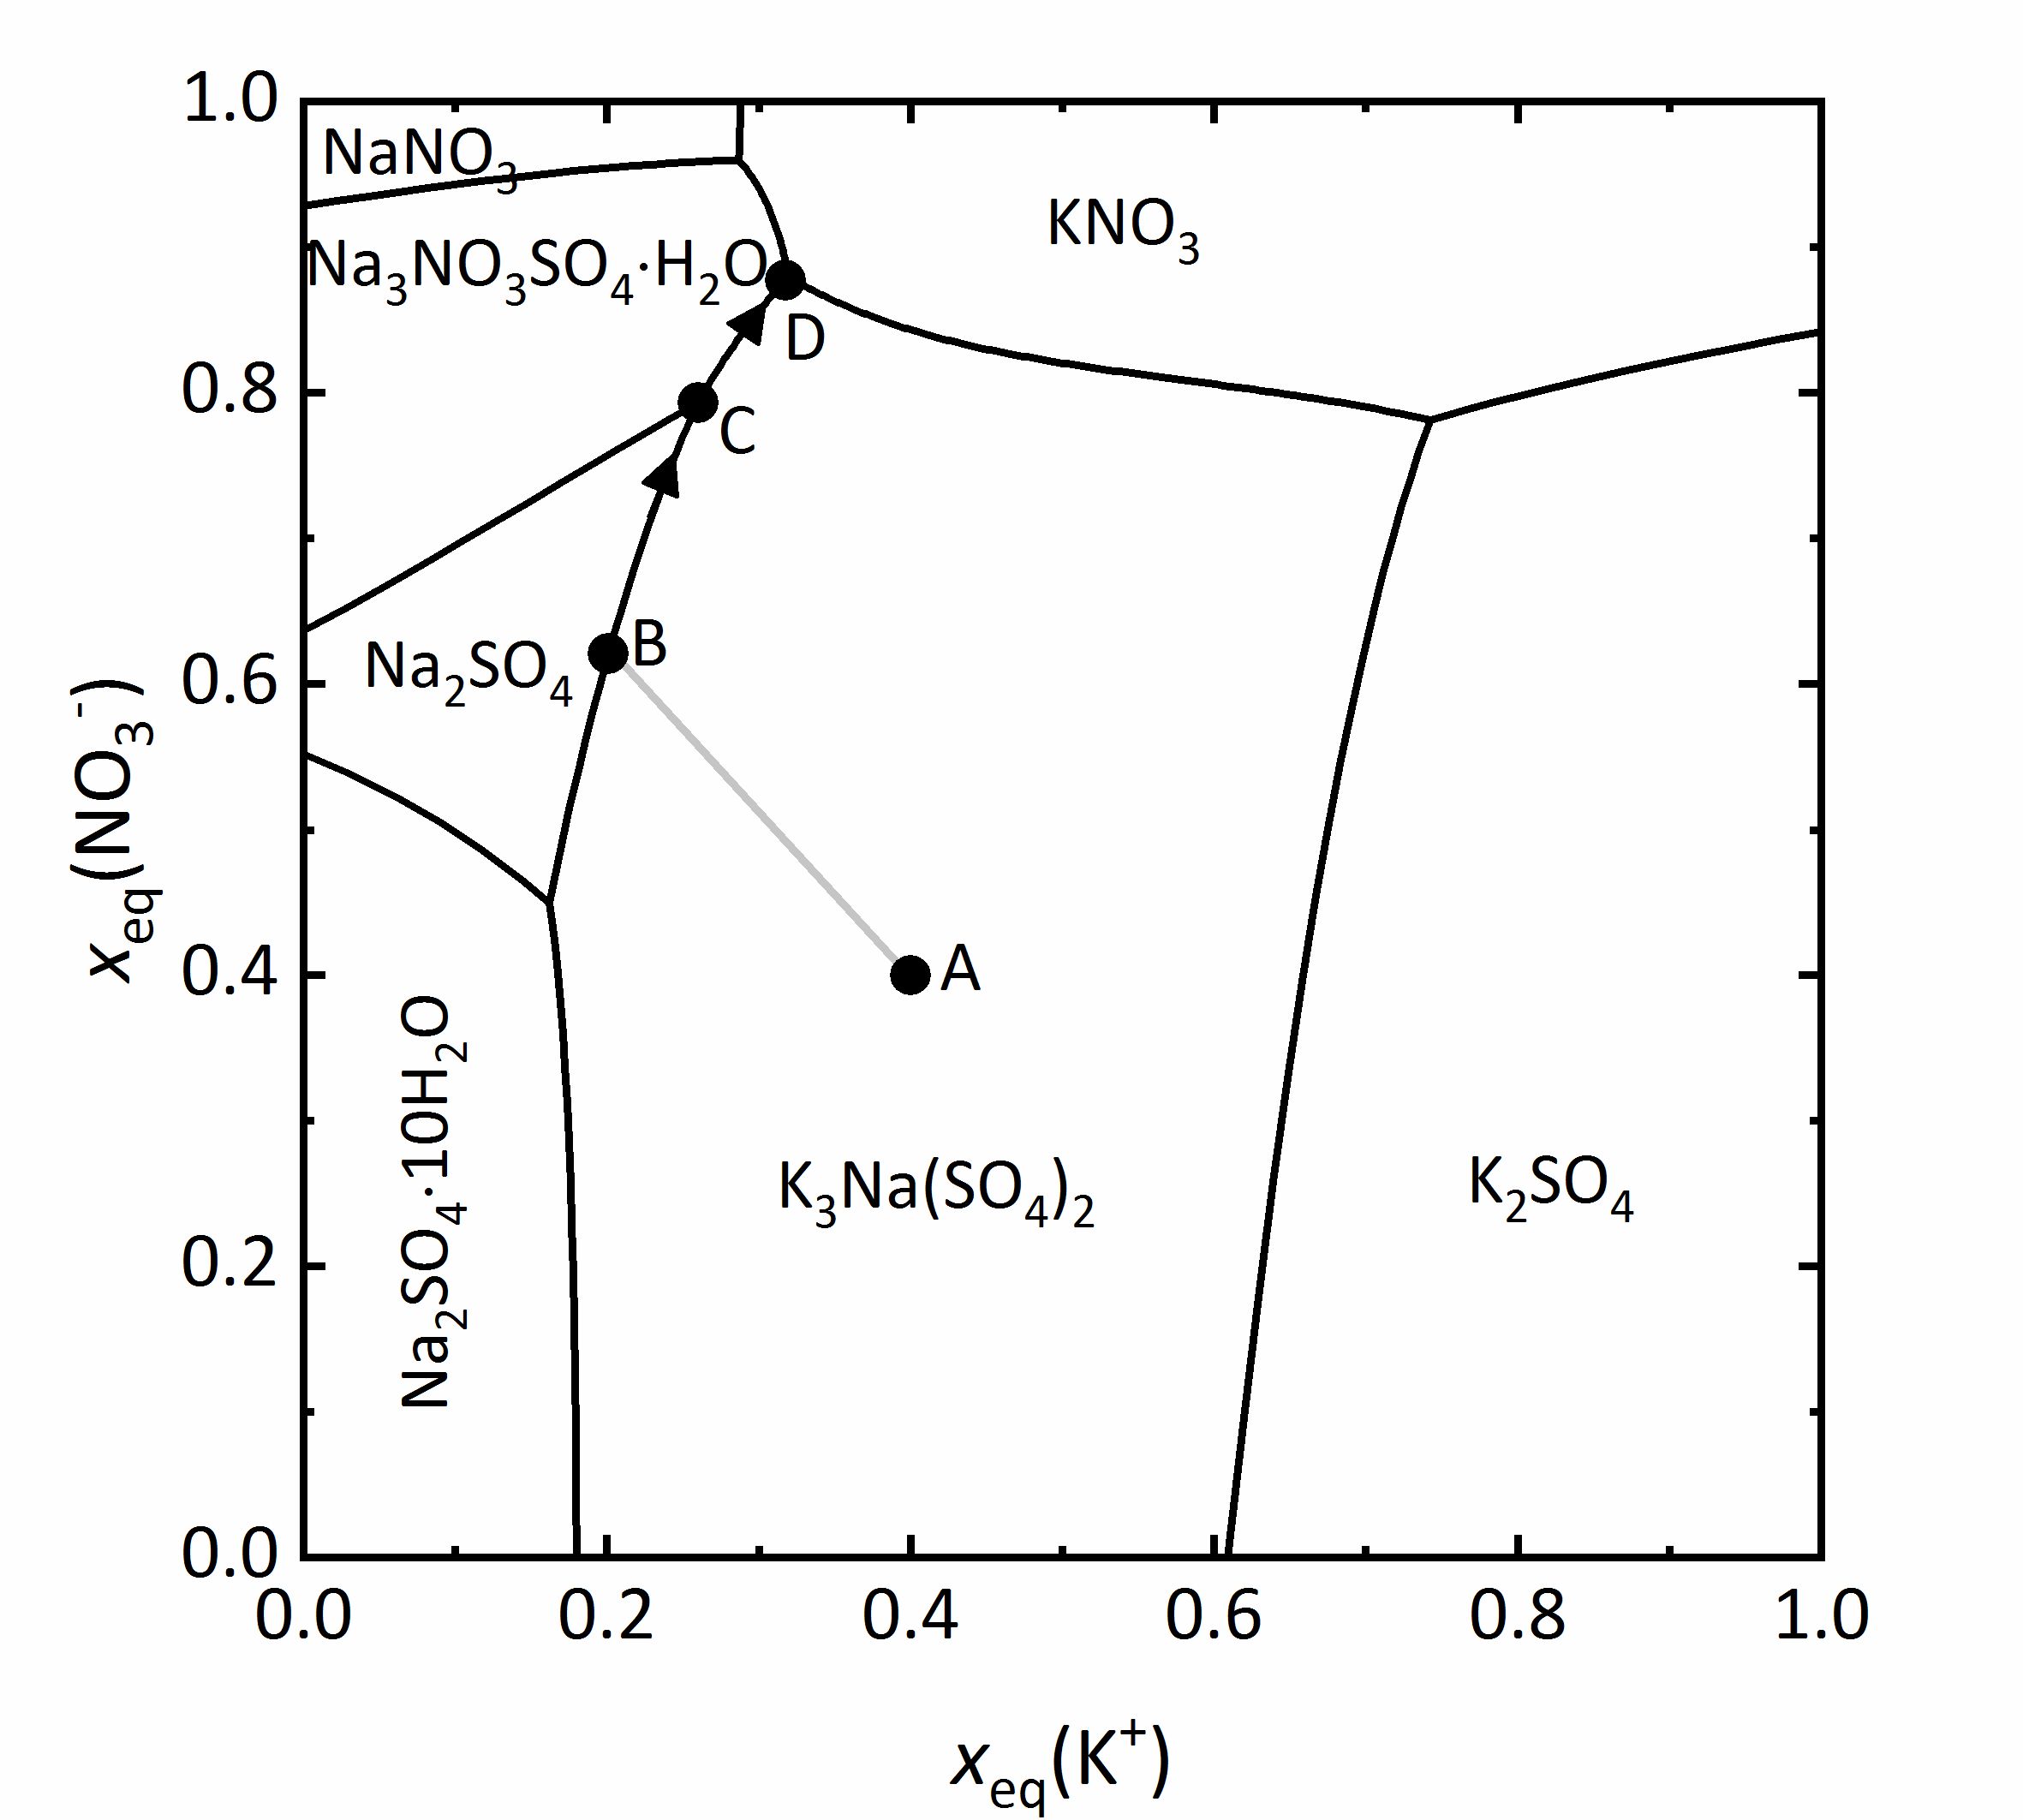
Author: Jaenecke, E. bezeichnet. Als Beispiel für ein solches Diagramm soll das eines Gemischs aus Na+-K+-NO3--SO42--H2O bei 25 °C aus Abbildung 11 besprochen werden. Auf der y-Achse sind die auf die Ladungsäquivalente bezogenen Molenbrüche der Nitrationen dargestellt, auf der x-Achse die der Kaliumionen. Alle Mischungen werden durch die auf die Ladungsäquivalente bezogenen Molenbrüche dargestellt, da auf diese Weise die Wertigkeit der Ionen berücksichtigt werden kann. Das bedeutet im Falle dieses Diagramms, dass sämtliche Mischungen als Teilbeitrag der Kalium-Kationen beziehungsweise der Nitrat-Anionen zur Gesamtmenge positiver beziehungsweise negativer Ladungen dargestellt werden. Beispielsweise leuchtet ein, dass bei sehr geringen Stoffmengenanteilen an Kalium- und Nitrat-Ionen Natrium- und Sulfat-Ionen überwiegen. Somit liegen in den Ecken die vier reinen Salze vor. Unten links Natriumsulfat, oben links Natriumnitrat, oben rechts Kaliumnitrat und unten rechts Kaliumsulfat. Die Felder innerhalb des Diagramms zeigen die Stabilitätsfelder der möglichen Phasen. Sie werden durch Linien getrennt, durch die die Sättigungskonzentrationen von Lösungen angegeben werden, bei denen die jeweils angrenzenden Phasen im Gleichgewicht vorliegen. Das heißt, dass innerhalb eines Feldes nur Sättigung in Bezug auf eine einzige Phase vorliegt, an Schnittpunkten von Sättigungskurven liegen drei Phasen gemeinsam im Gleichgewicht vor. An diesen Schnittpunkten liegen isotherme invariante Phasen vor (Phasenregel) [Steiger.etal:2014]Title: Weathering and Deterioration
Author: Steiger, Michael; Charola A. Elena; Sterflinger, Katja .
.
Als Anwendungsbeispiel soll eine Lösungszusammensetzung von Punkt A betrachtet werden. Dieser liegt im Stabilitätsfeld von Glaserit (NaK3(SO4)2), so dass diese Phase bei Eindunstung der Lösung zuerst auskristallisieren würde. Durch die Kristallisation verändert sich bei voranschreitender Verdunstung die Lösungszusammensetzung, wobei die beteiligten Ionen proportional zu ihrem Vorkommen im auskristallisierenden Salz der Lösung entzogen werden. Dies erfolgt entlang der Linie A-B. An Punkt B liegt auch Sättigung in Bezug auf Thenardit vor, so dass die beiden Salze gemeinsam auskristallisieren. Durch weitere Kristallisation der beiden Phasen verändert sich die Lösungszusammensetzung weiter, und zwar entlang der Linie B-C. An diesem Punkt ist auch Sättigung in Bezug auf Darapskit (Na3NO3SO4∙H2O) erreicht. Da es sich bei dem Punkt jedoch um einen invarianten Punkt handelt, liegen nur dort die drei Phasen gemeinsam vor. Beim weiteren Eindunsten der Lösung muss Thenardit sich auflösen, da sein Stabilitätsfeld beim Verlauf entlang C-D verlassen wird. Endpunkt der Kristallisation ist der invariante Punkt D [Steiger:2009a]Title: Modellierung von Phasengleichgewichten
Author: Steiger, Michael [Steiger.etal:2008c]Title: An improved model incorporating Pitzer’s equations for calculation of thermodynamic properties of pore solutions implemented into an efficient program code
Author: Steiger, Michael; Kiekbusch, Jana; Nicolai, Andreas .
.
Author: Steiger, Michael
 , berechnet nach [Steiger.etal:2008c]Title: An improved model incorporating Pitzer’s equations for calculation of thermodynamic properties of pore solutions implemented into an efficient program code
Author: Steiger, Michael; Kiekbusch, Jana; Nicolai, Andreas
 .
.
Aussagekraft haben diese Phasendiagramme neben der Ableitung von Kristallisationsabfolgen aber noch in anderer Hinsicht. Die Größe der Stabilitätsfelder verschiedener Phasen geben Hinweise darüber, wie wahrscheinlich es ist, dass diese Phase aus dem Gemisch auskristallisiert. Je größer das Feld, desto mehr Zusammensetzungen können zur Phasenbildung führen. Außerdem ist es wichtig ableiten zu können, welche Phasen des Gemischs gemeinsam vorliegen können. Nur aneinander grenzende oder durch invariante Punkt verbundene Phasen können gemeinsam auftreten. Somit wäre es in dem besprochenen Beispiel nicht möglich, Mirabilit zusammen mit Kaliumnitrat oder Kaliumsulfat zu identifizieren [Steiger.etal:2014]Title: Weathering and Deterioration
Author: Steiger, Michael; Charola A. Elena; Sterflinger, Katja .
.
Literature[edit]
| [Arnold.etal:1991] | Arnold, Andreas; Zehnder, Konrad (1991): Monitoring Wall Paintings Affected by soluble Salts. In: Cather, Sharon (eds.): The Conservation of Wall Paintings: Proceedings of a symposium organized by the Coutrauld Institut of Art and the Getty Conservation Institute, London, July 13-16, The Getty Conservation Institute, 103-136. |  |
| [Espinosa.etal:2008] | Espinosa, R.; Franke, L.; Deckelmann, G. (2008): Model for the mechanical stress due to the salt crystallization in porous materials. In: Construction and Building Materials, 22 (7), 1350-1367, Url, 10.1016/j.conbuildmat.2007.04.013 |  |
| [Genkinger.etal:2007] | Genkinger, Selma; Putnis, Andrew (2007): Crystallisation of sodium sulfate: supersaturation and metastable phases. In: Environmental Geology, 52 (2), 329-337, 10.1007/s00254-006-0565-x |  |
| [Grossi.etal:2013] | Grossi, C.M.; Esbert, R.M.; Suarez del Rio, L.M.; Montoto, M.; Laurenzi-Tabasso, M. (2013): Acoustic emission monitoring to study sodium sulphate crystallization in monumental porous carbonate stones. In: Studies in Conservation, 42 (2), 115-125 |  |
| [Jaenecke:1906] | Jaenecke, E. (1906): Über eine neue Darstellungsform der wässerigen Lösungen zweier und dreier gleichioniger Salze, reziproker Salzpaare und der van't Hoffschen Untersuchungen über ozeanische Salzablagerungen.. In: Z. Anorg. Allg. Chem., 51 (), 132 |  |
| [Linnow.etal:2006] | Linnow, Kirsten; Zeunert, Anke; Steiger, Michael (2006): Investigation of Sodium Sulfate Phase Transitions in a Porous Material Using Humidity- and Temperature-Controlled X-ray Diffraction. In: Analytical Chemistry, 78 (13), 4683-4689, 10.1021/ac0603936 |  |
| [Price.etal:1994] | Price, Clifford A.; Brimblecomb, Peter (1994): Preventing salt damage in porous materials. In:: Preventive conservation: practice, theory and research. Preprints of the contributions to the Ottawa Congress, 12-16 September 1994, International Institute for Conservation of Historic and Artistic Works, 90-93. |  |
| [Steiger.etal:1995] | Steiger, Michael; Dannecker, Walter (1995): Hygroskopische Eigenschaften und Kristallisationsverhalten von Salzgemischen. In: Snethlage, Rolf (eds.): Jahresberichte Steinzerfall - Steinkonservierung für 1993, Verlag Ernst & Sohn, 115-128. |  |
| [Steiger.etal:1996] | Steiger, Michael; Zeunert, Anke (1996): Crystallization properties of salt mixtures: Comparison of experimental results and model calculations. In: Riederer, Josef (eds.): Proceedings of the 8th International Congress on Deterioration and Conservation of Stone, , 535-544. |  |
| [Steiger.etal:2008] | Steiger, Michael; Asmussen, Sönke (2008): Crystallization of sodium sulfate phases in porous materials: The phase diagram Na2SO4–H2O and the generation of stress. In: Geochimica et Cosmochimica Acta, 72 (17), 4291-4306, Url |  |
| [Steiger.etal:2008c] | Steiger, Michael; Kiekbusch, Jana; Nicolai, Andreas (2008): An improved model incorporating Pitzer’s equations for calculation of thermodynamic properties of pore solutions implemented into an efficient program code. In: Construction and Building Materials, 22 (8), 1841-1850, 10.1016/j.conbuildmat.2007.04.020 |  |
| [Steiger.etal:2014] | Steiger, Michael; Charola A. Elena; Sterflinger, Katja (2014): Weathering and Deterioration. In: Siegesmund S.; Snethlage R. (eds.): Stone in Architecture, Springer Verlag Berlin Heidelberg, 223-316, 10.1007/978-3-642-45155-3_4. |  |
| [Steiger:2009a] | Steiger, Michael (2009): Modellierung von Phasengleichgewichten. In: Schwarz, Hans-Jürgen; Steiger, Michael (eds.): Salzschäden an Kulturgütern: Stand des Wissens und Forschungsdefizite, Ergebnisse des DBU Workshops im Februar 2008 in Osnabrück, Deutsche Bundesstiftung Umwelt, Eigenverlag, 80-99. |   |
| [Xu.etal:1999] | Xu B., Schweiger G. (1999): In-situ Raman observations of phase transformation of Na2SO4 during the hydration/dehydration cycles on single levitated microparticle.. In: J. Aerosol. Sci., (), 379-380 |  |
Kategorie: Grundlagen Kategorie: Salz Kategorie:Stahlbuhk,Amelie Kategorie: R-MSteiger
